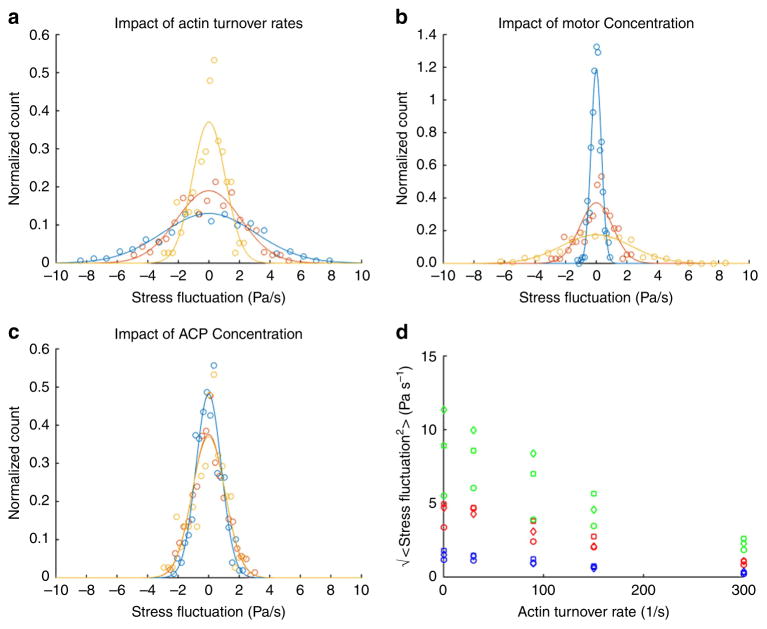
Figure 5. Stress fluctuation magnitudes are modulated by network turnover and motor activity.
(a) Network configuration (10% ACPs, 1% motors). Increasing the actin turnover rate from 90 (blue) to 150 (red) to 300 s −1 (blue) leads to a decrease in the spread of the stress fluctuations. (b) Network configuration (10% ACPs, 300 s −1 actin turnover rate). Increasing the motor concentration from 0.1% (blue) to 1% (red) to 5% (yellow) increases the s.d. of the stress fluctuation distribution. (c) Network configuration (1% motors, 300 s −1 actin turnover rate). Increasing the ACP concentration from 1% (blue) to 5% (red) to 10% (yellow) does not appear to alter the s.d. of the stress fluctuation distribution. Stress fluctuations were measured over a total area of 27 μm2 (9 μm2 in each orthogonal axis) in each simulation domain. Stress fluctuation distributions from computational data (circles) were normalized and fitted to a normalized Gaussian with identical s.d. (lines). (d) Amplitude of stress fluctuations. Blue, red and green correspond to motor concentrations of 0.1%, 1% and 5%, respectively. Circles, squares and diamonds correspond to ACP concentrations of 1%, 5% and 10%, respectively. Percentages are relative to the actin concentration of 25 μM used in these simulations.

