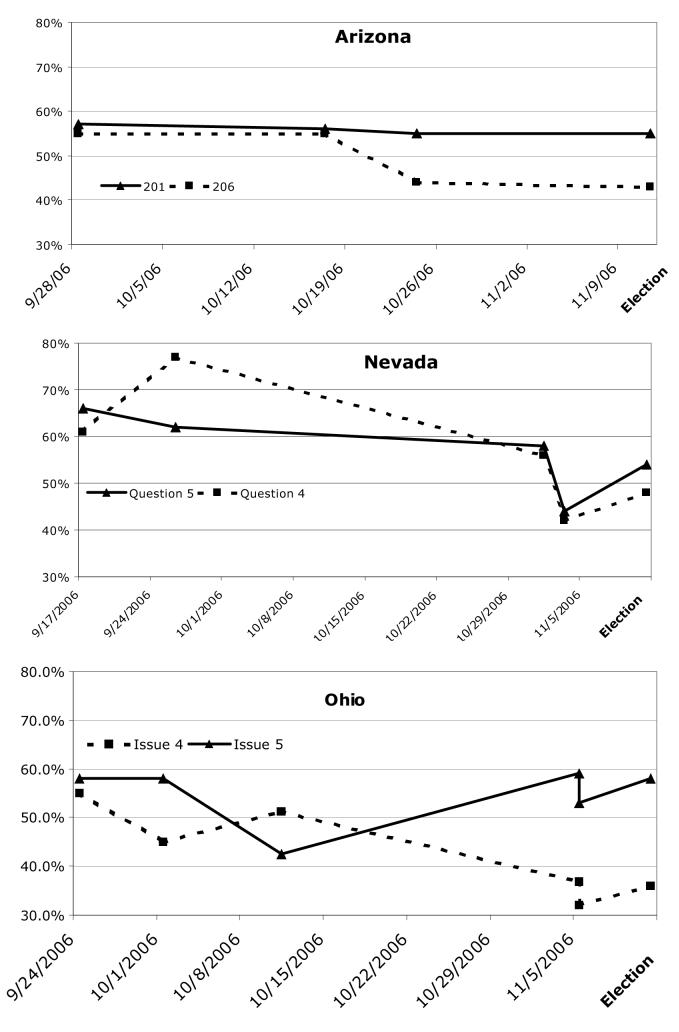
Figure 2.
Polling and Election Results for Arizona42, 49-51, Nevada52-55, and Ohio56-60. Health group campaigns are represented by solid lines and pro-tobacco campaigns are represented by dotted lines. Polls in September 2006 showed the competing initiatives in all three states passing. As the campaigns progressed the support to the health group campaigns stayed consistent while support for the pro-tobacco campaigns eroded.

