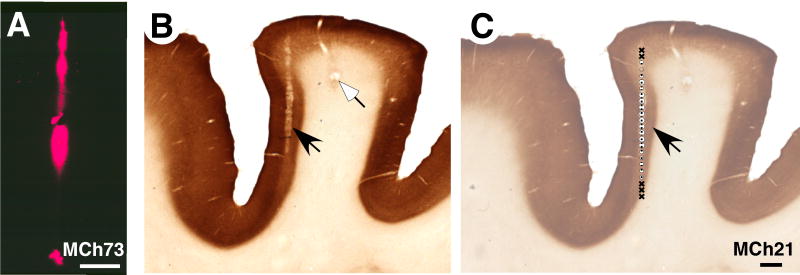
Fig. 2.
(A) A photomicrograph showing a fluorescent electrode track in a section of the cortex cut tangentially to the surface through area 3b of monkey MCh73. The electrode was dipped in DiI before making the penetration. (B) A ‘continuous’ electrolytic lesion (see ‘Methods’) marking the electrode track (black arrow) in area 3b of the posterior bank of the central sulcus of monkey MCh21 and a focal lesion (white arrow). The section of the cortex was cut in a plane perpendicular to the central sulcus and stained for cytochrome oxidase. (C) An example of recording sites along the electrode tract of the section shown in ‘B’ (black arrow). For legend to the symbols see legend to figure 4A. Scale bar in ‘A’ is 500 μm and in ‘C’ is 1 mm.

