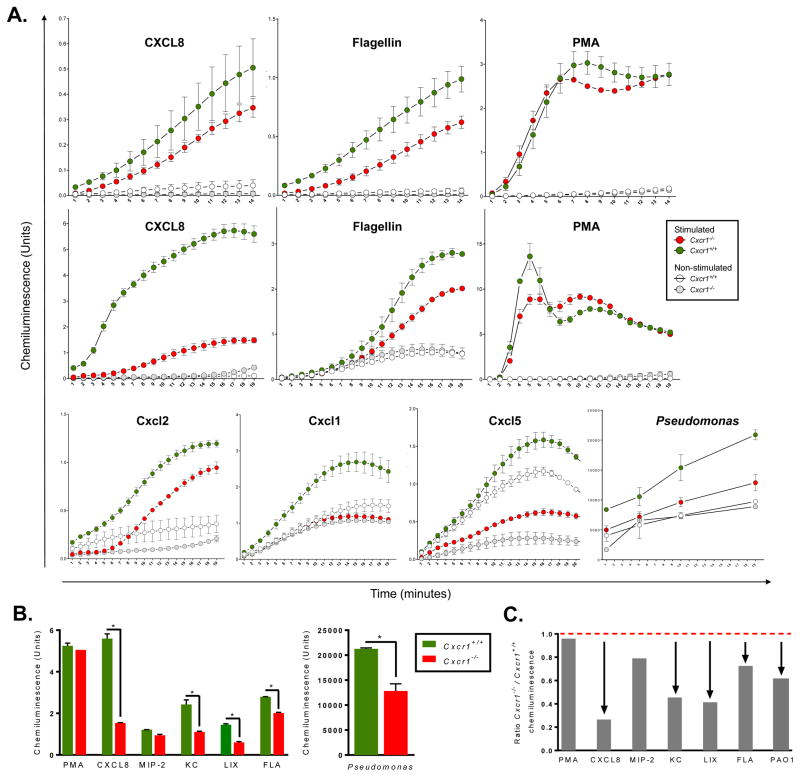
Fig. 2. Reactive oxygen species.
Total bone marrow cells (A, upper row) or neutrophils isolated from bone marrow (A, middle and lower row) of age- and sex-matched Cxcr1+/+ and Cxcr1−/− mice were stimulated with recombinant chemokines (all at 100 ng), flagellin (100 ng), PMA (200 nM) or Pseudomonas aeruginosa (PAO1) bacteria (2×10⁶/ml). Reactive oxygen species (ROS) production was measured using chemiluminescence. Figure 2B and C show summarizing bar graph plots (medians with IQRs in 2B, ratios in 2C) of stimulated Cxcr1+/+ versus Cxcr1−/− neutrophils, as absolute chemiluminescence units (B) or as ratio of Cxcr1−/− to Cxcr1+/+ neutrophils (C). * (B) or arrows (C): P < 0.05 Cxcr1+/+ versus Cxcr1−/− neutrophils

