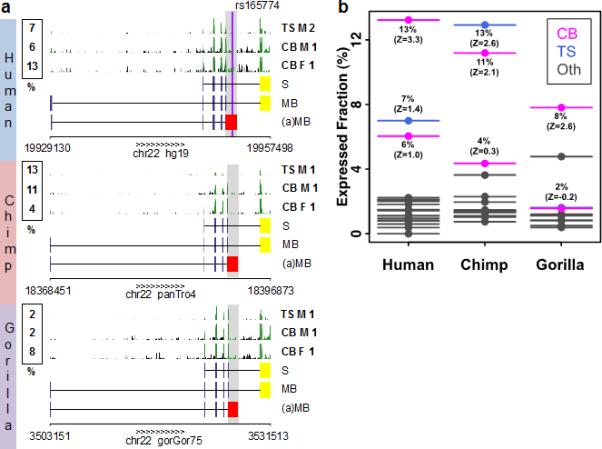
Figure 2. Expression levels of COMT isoforms.

The relative expression level (%) of the (a)MB-COMT versus the MB-COMT is compared between primates and tissue types. (a) The expression levels are estimated from mRNA-Seq data (GEO set GSE30352), the region highlighted in grey is assessed. The raw mRNA-Seq data pileup (clipped at height 25) are shown for cerebellum (CB) and testis (TS), in both male (M) and female (F) individuals from human (top), chimp (middle) and gorilla (bottom). The exon tracks for the reference S-COMT, reference MB-COMT and (a)MB-COMT isoform are shown. The last exon – unique for (a)MB-COMT isoform – is colored in red; the last exon – unique for reference isoforms – is colored in yellow. (b) Z-scores are computed from the distribution of expression levels across tissues in a given specie. Tissue types include cerebellum (CB; magenta), testis (TS, blue), brain minus cerebellum, heart, kidney, and liver (Oth; grey).
