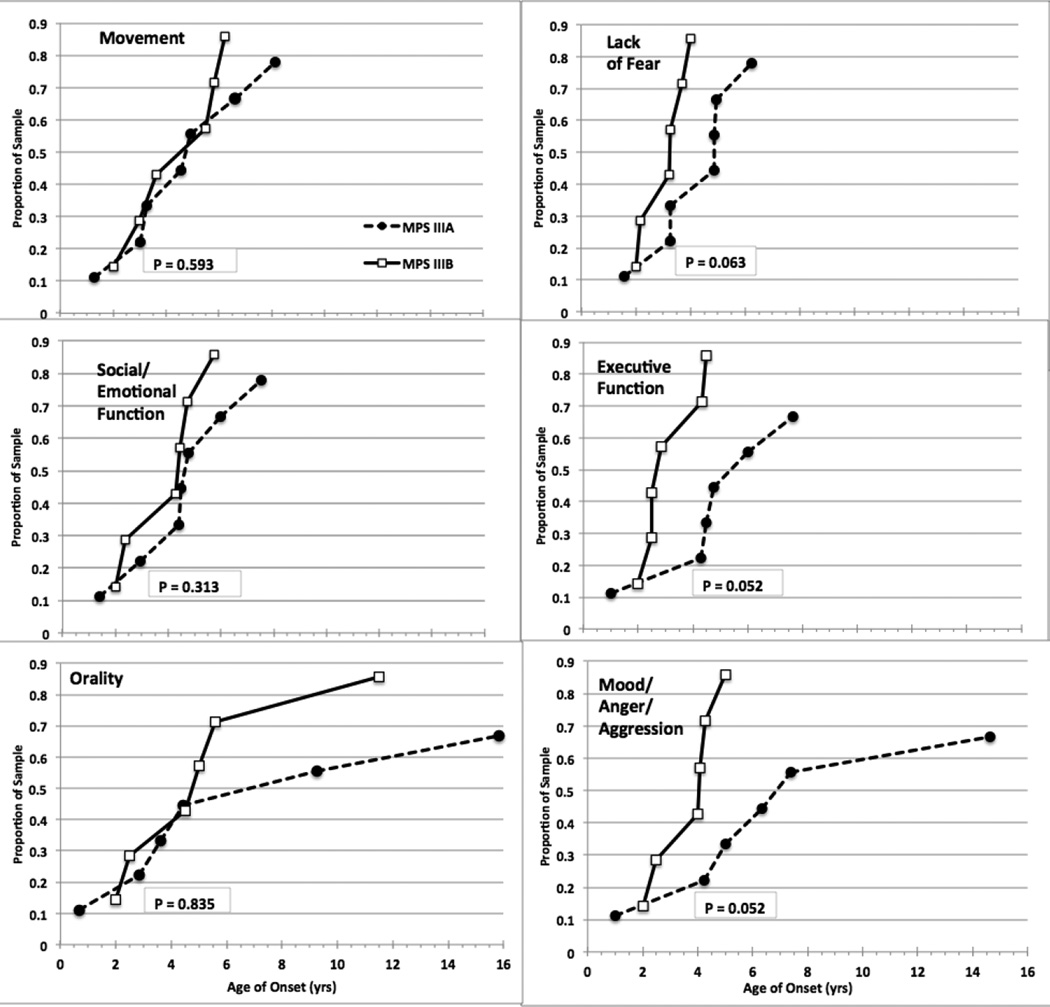
Figure 1. Age of onset data from SBRS as recalled by parents.
Comparison of MPS IIIA and IIIB within-group time-to-event plots for onsets of six behavior clusters and domains. The same age scale is used in all plots. Final sample proportions are less than 1.0 due to missing data. Between group differences in the right hand plots show a trend or are significant.

