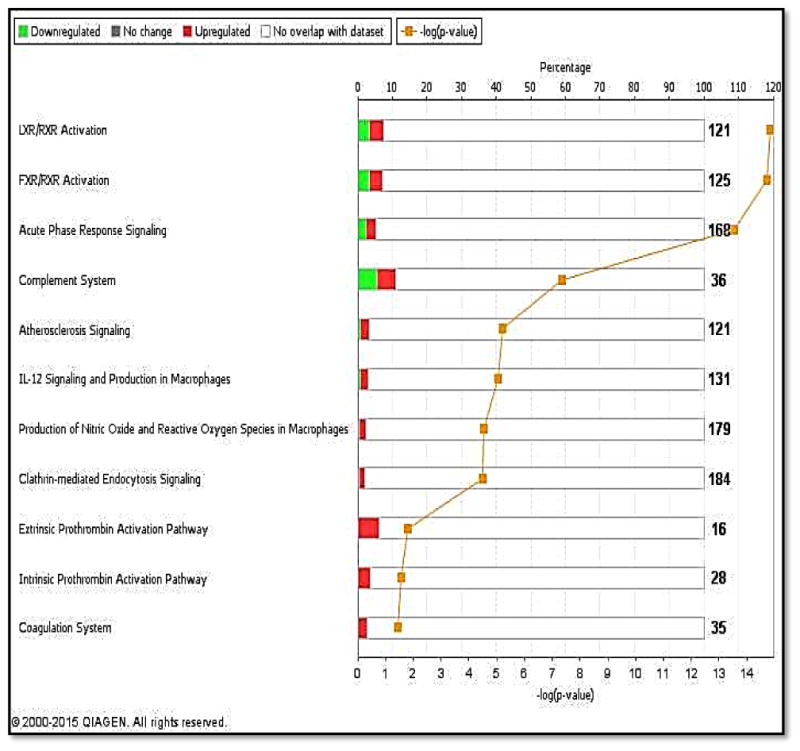
Figure 2. Canonical Pathways significantly enriched in the 20 DEPs.

Bars represent total number of molecules in a pathway; upper Y-axis represents the ratio between the number of molecules in our dataset that is associated with a pathway and the total number of molecules in that pathway; Lower Y-axis represents –log of the p-value associated with each pathway. X-axis lists the top pathways associated with the DEPs.
