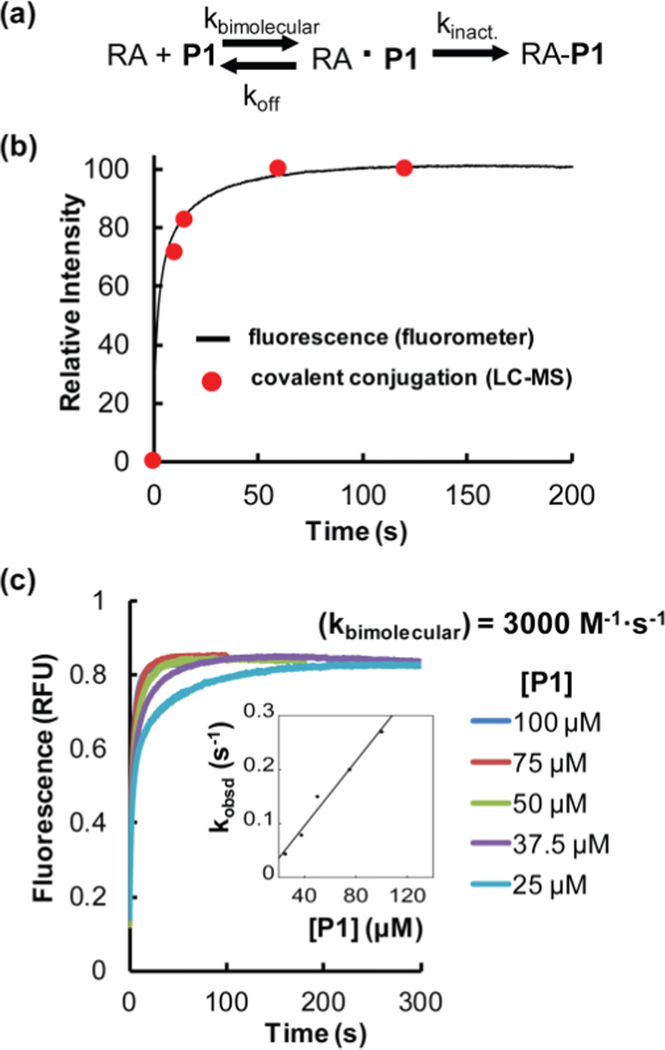
Figure 5.
The folded and functional RA-P1 conjugate is fluorescent. (a) RA and P1 conjugation is modeled to proceed by two steps: P1 first binds reversibly to RA. Then the RA1•P1 complex undergoes a reaction to form the fluorescent conjugate. (b) RA (5 µM) was incubated with P1 (50 µM) at 25 °C. The fraction of covalent modification by LC-ESI-MS (red filled circles) correlates with the emergence of fluorescence (black curve) measured by stopped-flow fluorometry using an excitation wavelength of 390 nm and emission wavelength of 485 nm. The extent of covalent modification (second step; red filled circles) was monitored by taking samples from the reaction mixture at the indicated time points, quenching the reaction by acidification with hydrochloric acid, and measuring the relative peak intensity on LC-ESI-MS. (c) Measurement of the bimolecular association rate constant between RA (5 µM) and P1 by stopped-flow fluorometry as a function of the concentration of P1 (indicated).

