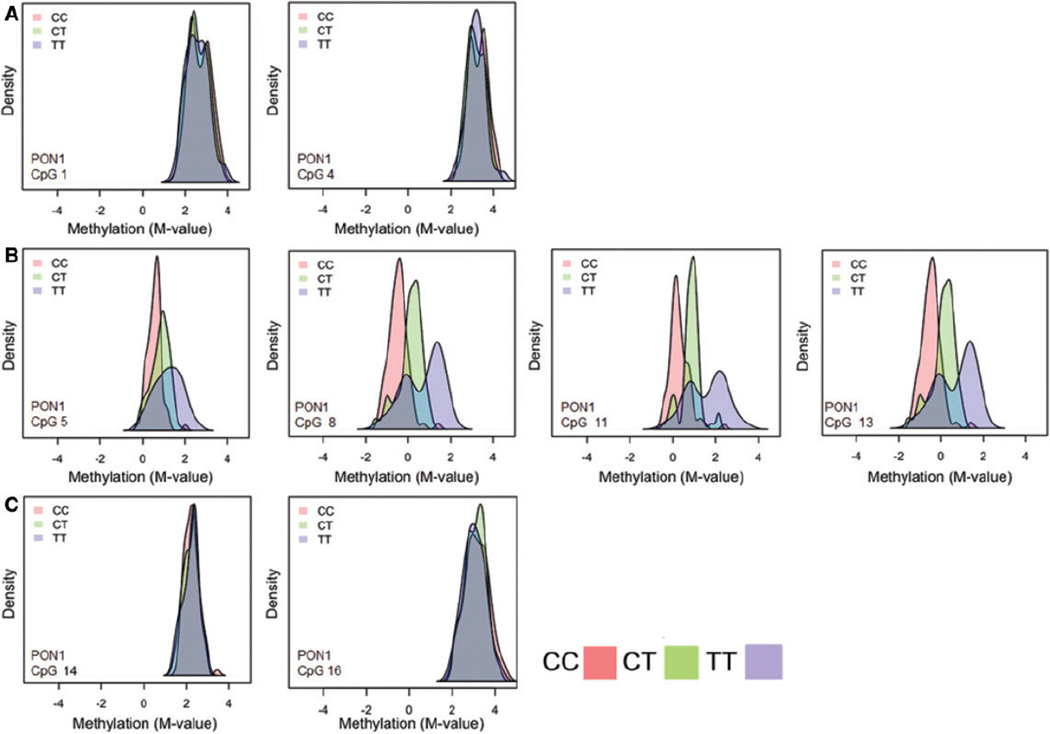
Figure 4.
Methylation density plots by PON1−108 genotype (CC-pink CT – green TT –purple). Each plot shows density by methylation M-value at eight different CpG sites, from different regions of PON1. Plots in Row A are CpG Sites 1 and 4, respectively. Plots in Row B are from methylation Block 1 (Sites 5, 8, 11, and 13). Plots in Row C show Sites 14 and 16 from methylation Block 2. We include plots from just a few CpG sites that are representative of other CpG sites in the same region. Among CHAMACOS newborns with methylation data (n = 271), 83 were CC, 138 were CT, and 50 were TT. Sites from methylation Block 1 show a distinct separation by PON1−108 genotype

