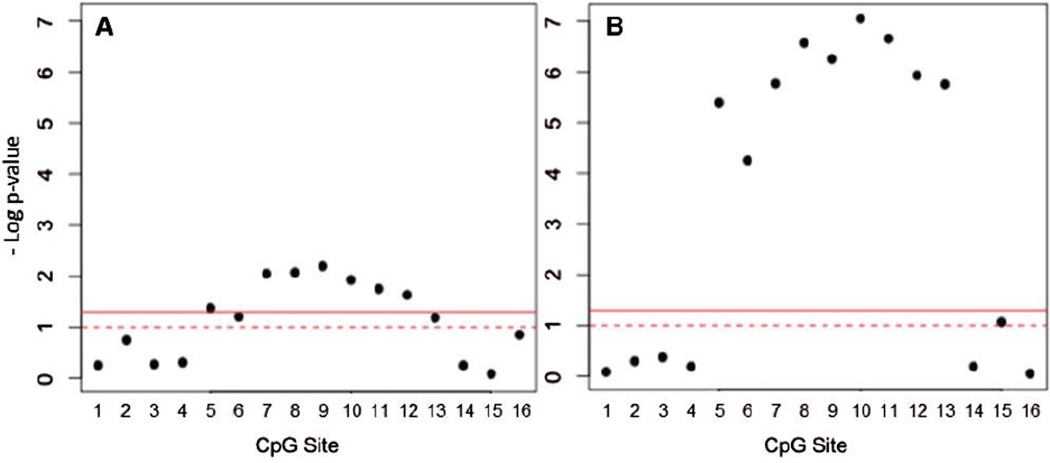
Figure 5.
Relationship of methylation with AREase activity. The plot shows regression P values for modelling the association of methylation at each individual CpG Site with AREase activity in (A) newborns and (B) 9-year olds. The solid line indicates a P value of 0.05 and the dotted line represents a P value of 0.01

