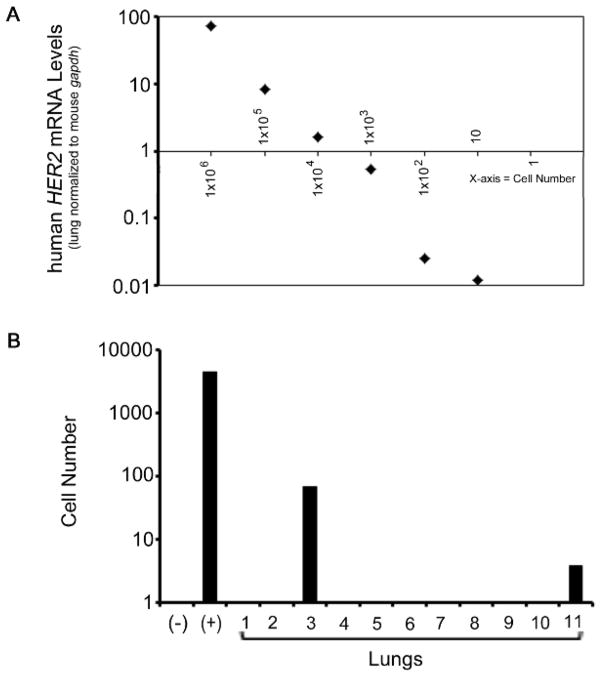
Figure 4. Representative QRT-PCR analysis from cell number analysis.
(A) Graph representing HER2 levels in relation to the cell number quantity of JIMT-1 cells from 1x10⁶ to 10 cells. (B) Bar graph representing the quantitated data from the QRT-PCR analysis of human HER2, a gene present in the JIMT-1 human breast cancer cell line. Human HER2 levels in the lung are normalized to mouse gapdh. (+) denotes positive control. (−) denotes negative control. Results are plotted on a log-scale. Please click here to view a larger version of this figure.

