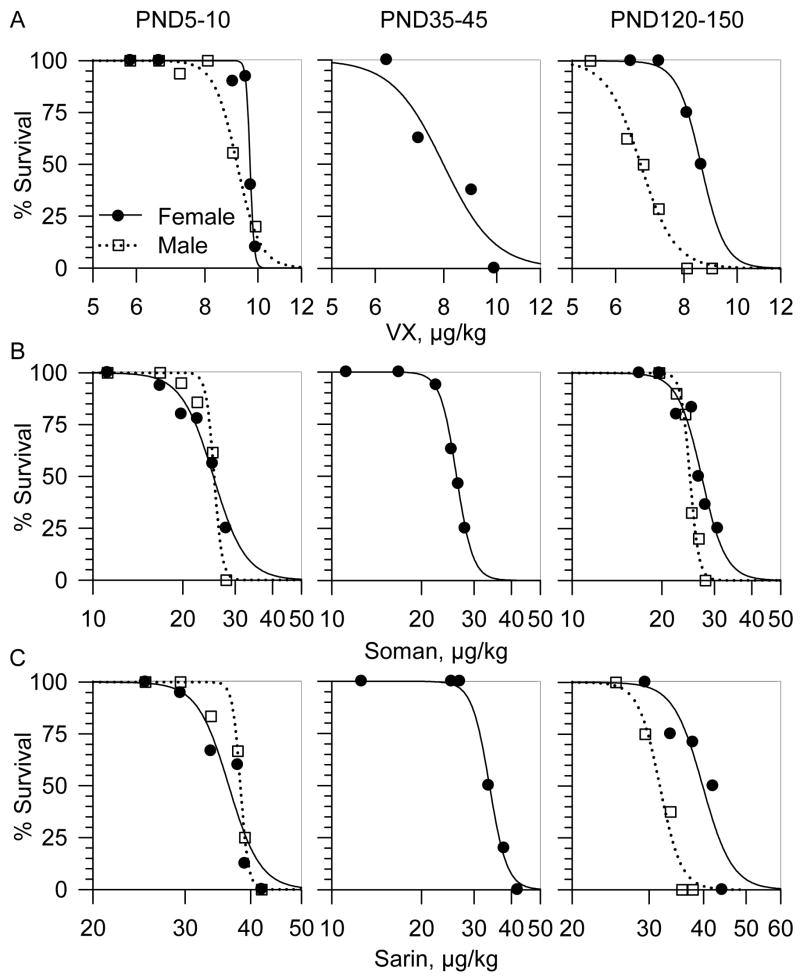
Figure 1. Mortality dose-response relationships for VX, soman and sarin in male and female guinea pigs at PND5-10, PND35-45 and PND120-150.
Guinea pigs received an sc injection of VX (A), soman (B) or sarin (C) and were then observed for 24 h. Following the IACUC guidelines, animals were euthanized as soon as they developed life-threatening symptoms, including unremitting or recurrent convulsions and/or gasping. The log dose-response relationships were fitted by a sigmoid equation of the form: y = axb/(cb + xb), where “y” is the % of survival after exposure to a given dose of nerve agent, “a” is the maximal % survival, “x” is the dose of the nerve agent, “c” is the median lethal dose, and “b” is the steepness of the curve. Each experimental group showing 100% survival consisted of 4 guinea pigs. Experimental groups in which survival outcome was < 100% consisted of 8 to 12 animals.

