Figure 1.
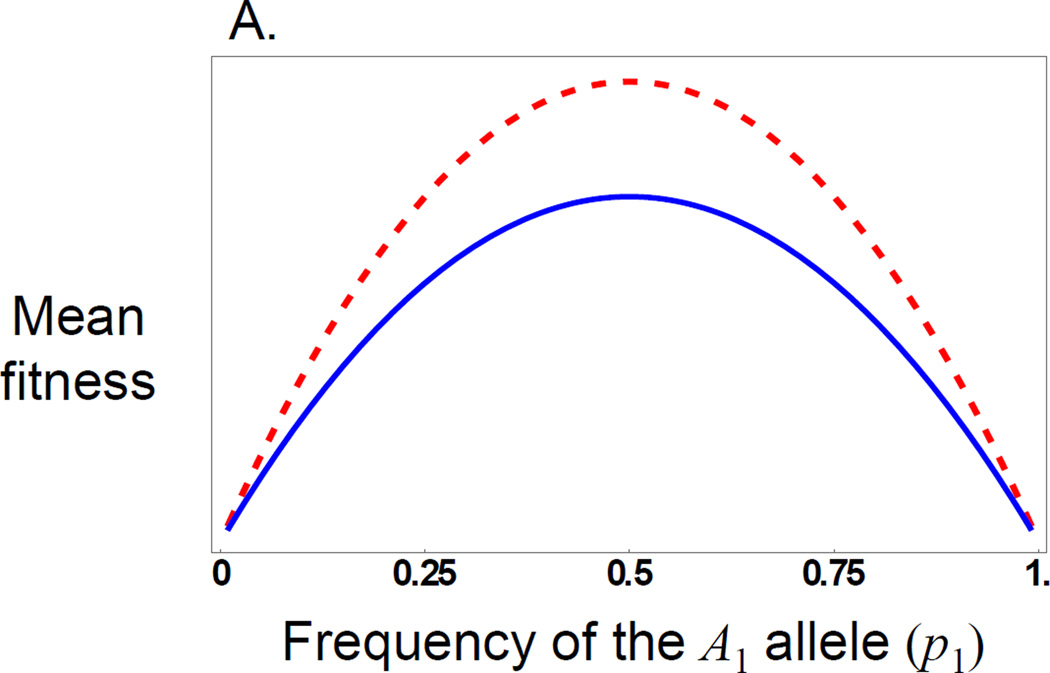
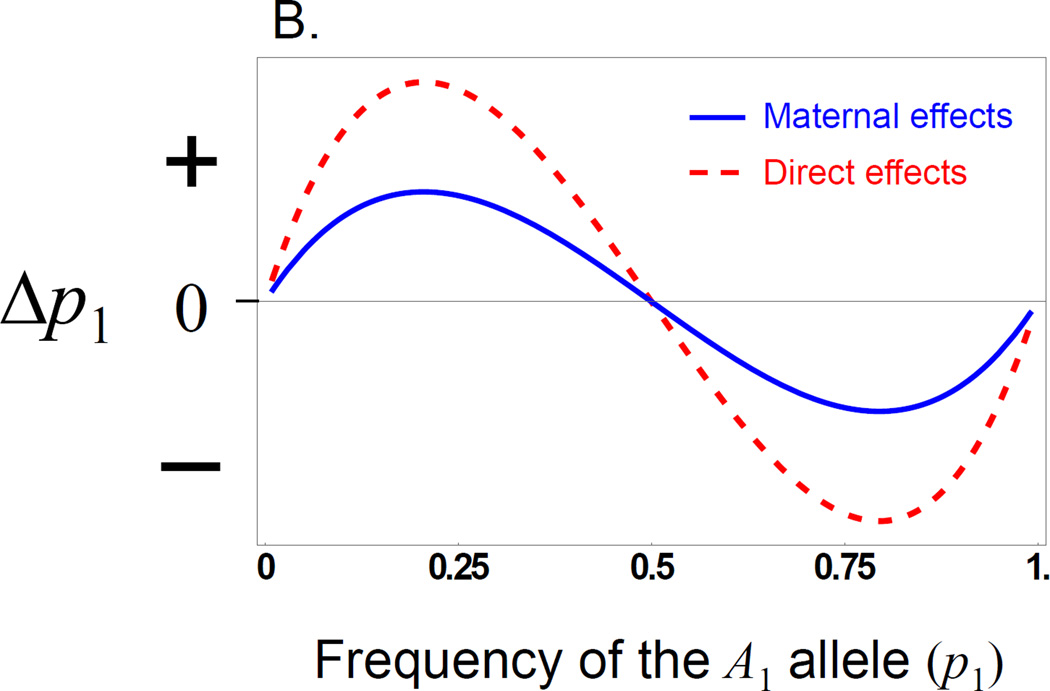
Evolution of overdominance with direct and maternal effects. These figures illustrate a case where there is a direct and a maternal effect of the same size showing only dominance (values are arbitrary, so the y axis is shown as unit free). A) The red (dashed) line shows the ‘surface’ of mean fitness, while the blue line (solid) shows the ‘realized adaptive landscape’ that determines how the population evolves. B) The change in allele frequency for a locus showing a direct or maternal dominance effect across allele frequency space. With either type of effect the population evolves to an internal equilibrium at p1 = 0.5 when there is allelic variation, but the direct effect (red, dashed) evolves to the equilibrium faster than the maternal effect (blue, solid), when started at the same gene frequency.


