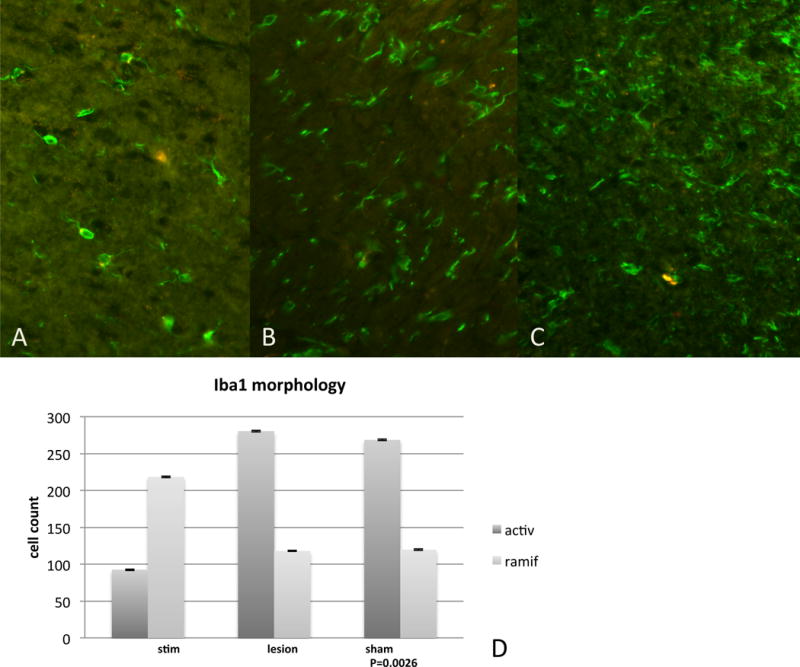
Figure 1.

Morphology of microglia: Figure 1a shows the normal or “ramified/quiescent” state of microglia, with branching processes. Figure 1b shows a mildly activated state of microglia, where the processes are beginning to retract. Figure 1c shows activated or “amoeboid” microglia, where processes are almost completely retracted and the cell bodies are round and macrophage-like. Figure 1d Morphometric quantification of the number of Iba1 positive cells in the STN of HFS animals compared to microlesion and sham animals and is representative of the quantitative difference (P=0.0026) between normal and activated microglia in animals that underwent HFS-DBS and sham animals as well as animals that underwent microlesioning.
