Figure 3.

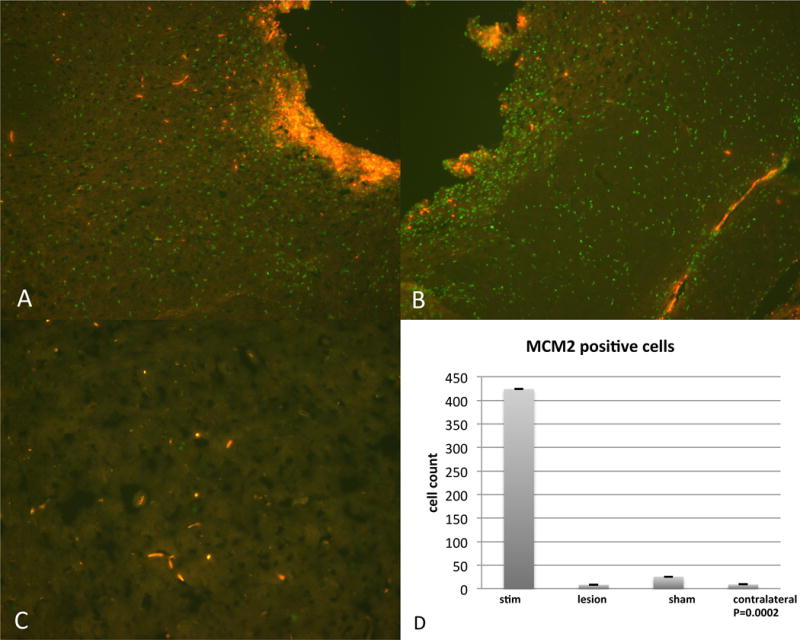
a, b): MCM2 positive (green) cells immediately surrounding electrode tip in STN-HFS animals. [orange is auto-fluorescent blood]
c): Contralateral side to HFS-STN demonstrating almost no MCM2 positive (green) cells in the STN.
d): Graph showing quantification of the number of MCM2 positive cells in the STN of HFS animals compared to microlesion, and sham animals. Also shown is STN in contralateral side of an HFS animal. Values in graph represent mean number of MCM2 positive cells per group of animals, P=0.0002.
