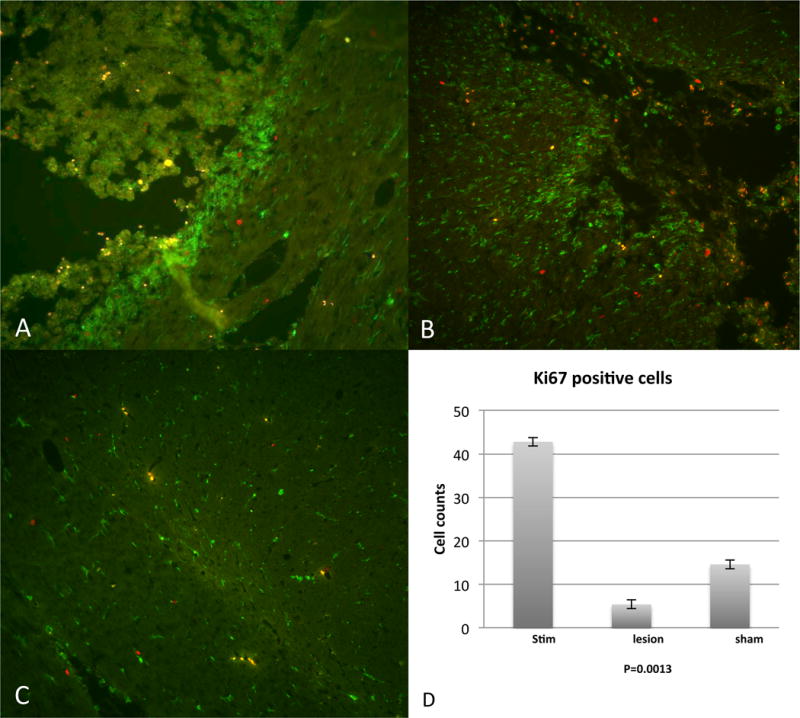
Figure 4.

a), b): Ki67 (red) and Iba1 (green) labeled cells in 2 representative HF-STN animals. Iba1 positive cells immediately surrounding the electrode site demonstrate amoeboid morphology, whereas immediately adjacent to the site of stimulation, cells demonstrate normal distribution and ramified morphology.
c): Bottom panel shows normal, ramified Iba1 microglia in the contralateral STN from HFS animals.
d): Graph representing the quantification of Ki67 positive cells in the STN in stimulated animals versus microlesion and sham animals, clearly demonstrating a significant increase in Ki67 positive cells in the stimulated group alone, P=0.0013.
