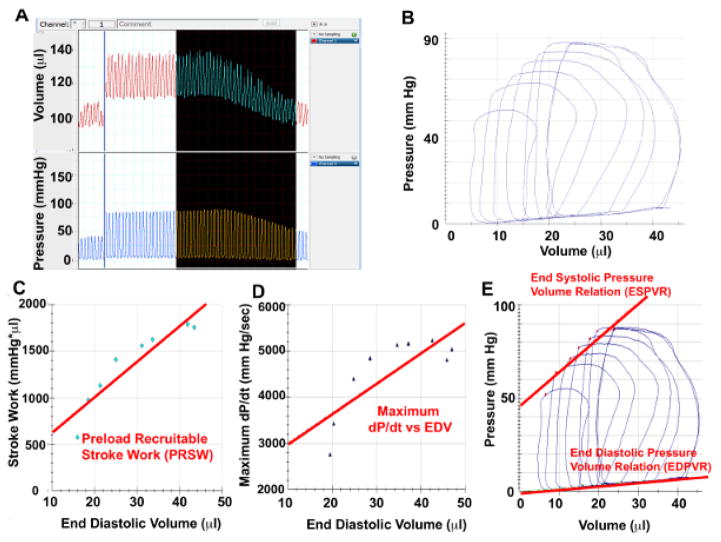
Figure 4. IVC Constriction Hemodynamics.
(A) Screenshots from pressure and volume channels of representative cardiac cycles during IVC constriction, (B) Selected pressure-volume loops during IVC constriction for analysis. Using the PV loops from IVC constriction, Preload Recruitable Stroke Work (C), Maximal dP/dt vs EDV (D) as well as ESPVR and EDPVR can be measured.

