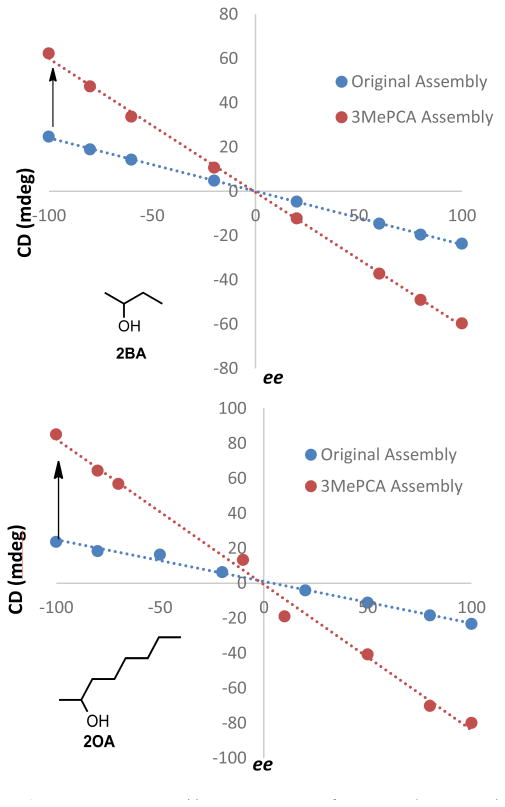
Figure 10.
Linear calibration curves of 2OA and 2BA with assemblies 1 and 3 were constructed with maximum cotton effect CD at 270 nm (R2= 0.99). The assemblies were formed at 35 mM (with 3 equiv. excess of alcohol), and CD was taken with a 175 μM assembly solution in MeCN. Assembly 3 calibration curves showed an increase in dynamic range in comparison to their original assembly counterparts.

