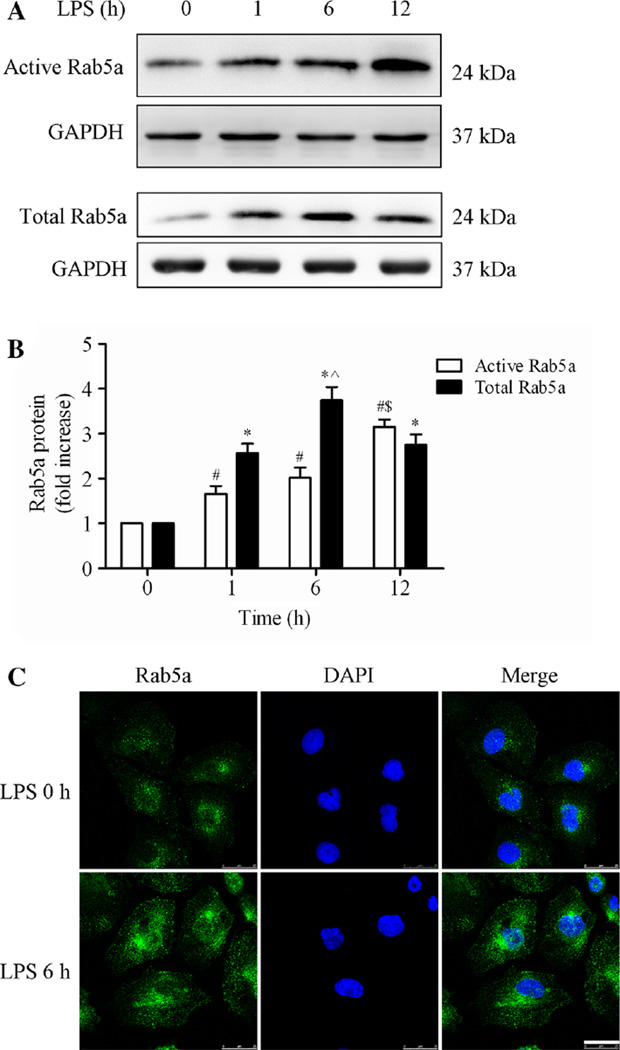
Fig. 1. Effect of LPS on the activity and expression of Rab5a in HPMECs.
a Expression of active and total Rab5a was measured by pulldown assay and Western blotting (WB) using polyclonal antibodies against Rab5a. Representative blots showing active Rab5a (upper panel), relative GAPDH (2nd panel), total Rab5a (3rd panel), and GAPDH expression (lower panel) are shown. HPMECs were cultured and treated with LPS (1 µg/ml) for various time intervals (1, 6, and 12 h). b Quantitative data of active and total Rab5a expression normalized to GAPDH expression. The data are presented as the mean ± SE (n = 3). For active Rab5a, #p < 0.05 versus the 0 h group, $p < 0.05 versus the 1 h group; for total Rab5a, *p < 0.05 versus the 0 h group, ^p < 0.05 versus the 1 h group. c HPMECs were cultured on coverslips and then treated with 1 µg/ml LPS for 6 h, fixed, and stained with an anti-Rab5a polyclonal antibody. The images represent three separate experiments. Green, Rab5a; blue, DNA stained with DAPI (nuclei). Scale bar, 25 µm

