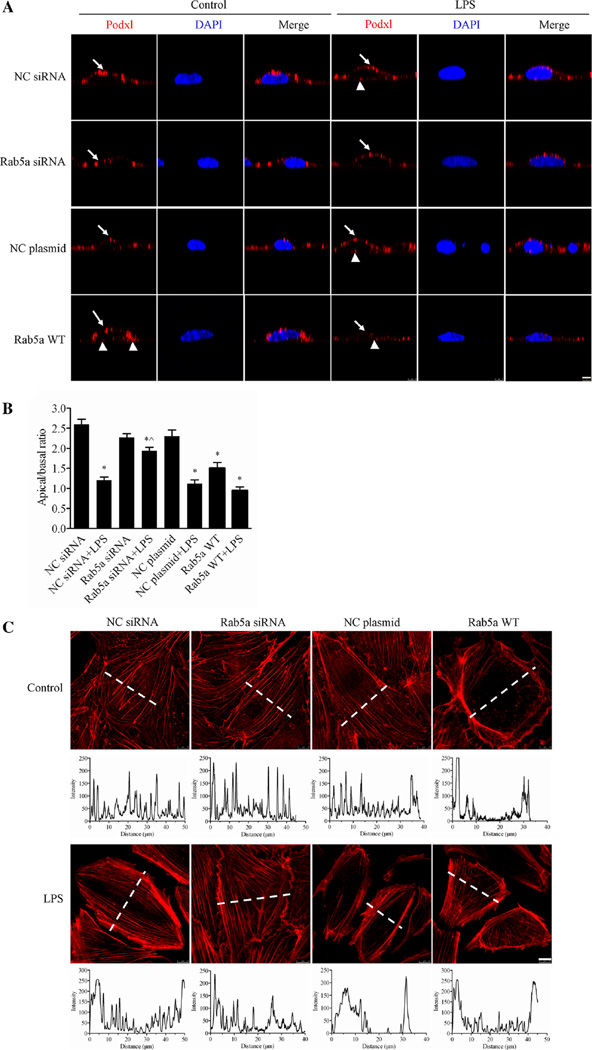
Fig. 7. Rab5a regulates the LPS-induced disruption of human endothelial cell polarity.
a Inhibitory effect of Rab5a siRNA on the LPS-induced disruption of HPMEC polarity. HPMECs cultured on Transwell inserts and transfected with NC siRNA, Rab5a siRNA, the NC plasmid, or the WT Rab5a plasmid were treated with 1 µg/ml of LPS for 6 h. The cells were then labeled with the apical protein marker Podxl. Red, Podxl; blue, DAPI. Arrows indicate Podxl localized at the apical surface of the cell. Arrowheads indicate Podxl distribution at the basal rather than apical surface of the cell. Z-axis, scale bar 5 µm. b Quantification of the apical/basal fluorescence intensity of the Podxl protein over time in a histogram. The apical or basal fluorescence intensity was calculated by integrating the area under the apical or basal peak defined via membrane labeling with Podxl using ImageJ software. The mean apical/basal fluorescence intensity was calculated in ten cells from three independent experiments. *p < 0.05 versus the NC siRNA group; ^p < 0.05 versus the NC siRNA plus LPS treatment group. c Inhibitory effect of Rab5a siRNA on the LPS-induced disruption of the F-actin cytoskeleton. Photograph of red fluorescence showing the distribution of F-actin in HPMECs (upper panel). Following pretransfection with NC siRNA, Rab5a siRNA, the NC plasmid, and the WT Rab5a plasmid, confluent HPMECs were stimulated with 1 µg/ml LPS for 6 h. The F-actin cytoskeleton was stained with rhodamine-phalloidin. Red, F-actin; blue, DAPI. Scale bar, 10 µm. Quantification of the F-actin fluorescence intensity is indicated in the corresponding histograms below the fluorescence images, which represent the intensity profiles of F-actin staining along the dotted lines in the photomicrographs, emphasizing differences in the cross-cellular F-actin expression

