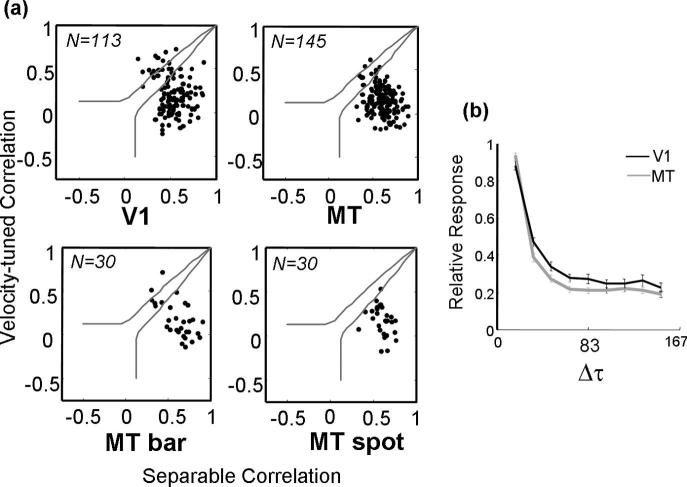
Figure 11.

Distributions of correlation values for the separable and inseparable predictions for V1 (top left) and MT (top right). Each dot corresponds to a neuron, and the solid gray lines show thresholds for significance at the level of p < 0.05. Neurons that fall between the two lines cannot be categorized as being consistent with either prediction. The bottom row shows a comparison of the correlation values for 30 MT neurons for which displacements maps were computed using long bars (left) and small spots (right). b, Normalized response strength as a function of the temporal separation between stimuli (Δτ) for the population of neurons in V1 (black) and MT (gray).
