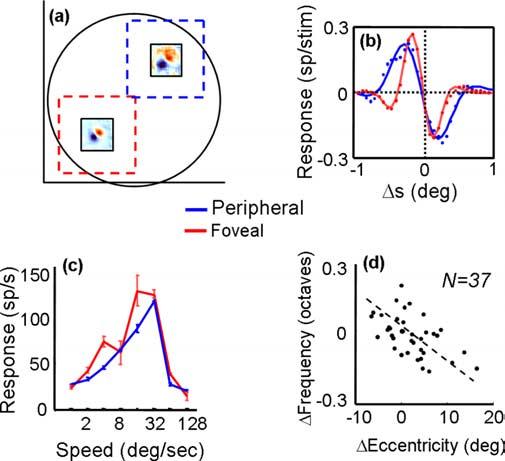
Figure 4.

a, Displacement maps computed at different eccentricities within the same MT receptive field. The dashed squares show the sizes and positions of random-dot patches used to measure speed tuning at the corresponding receptive field locations. b, Spatial profiles for the foveal (red) and peripheral (blue) displacement maps shown in a. Each dot corresponds to the response at a point along a line through the peak of each map. The solid curves are the best-fitting Gabor functions. c, Speed-tuning curves collected with random-dot fields centered on the foveal (red) and peripheral (blue) receptive field locations. Error bars indicate SD of the mean. d, Shift in frequency of the best-fitting Gabor as a function of change in retinal eccentricity for 37 displacement maps computed within the receptive fields of 17 MT neurons. Each dot corresponds to the difference in frequency for a given change in retinal eccentricity, and the dashed line is the result of a linear regression.
