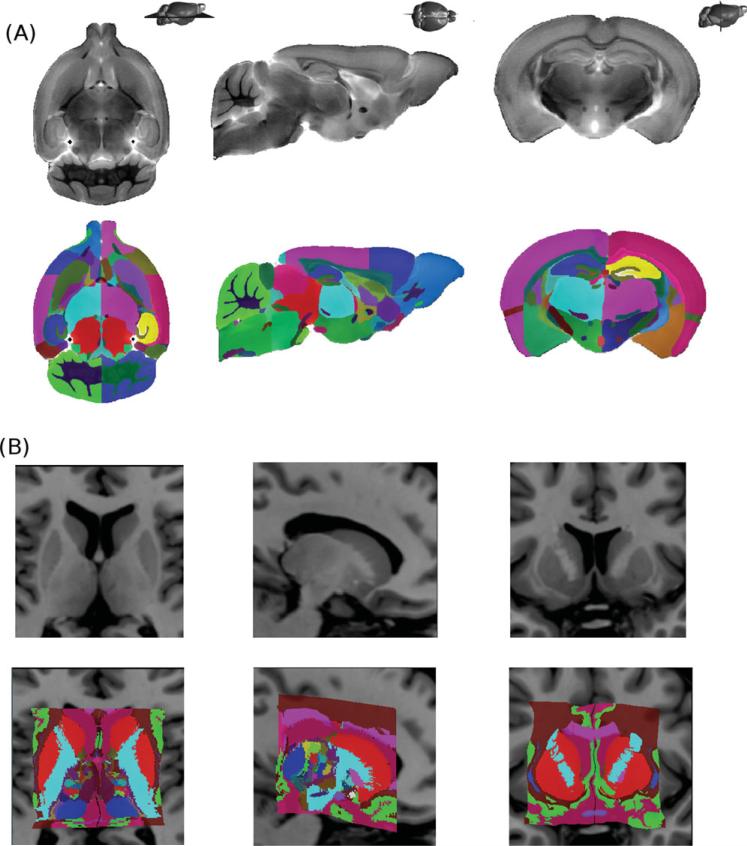
Figure 2.
Input atlases used. (A) MRI mouse brain atlas derived from the nonlinear average of 40 different mouse brain MRIs and contains 62 structures [Dorr et al., 2008]. (B) Atlas of the human basal ganglia and thalamus derived from the reconstruction of 82 serial histological sections which has been warped to a template brain. The final atlas contains 108 subcortical structures [Chakravarty et al., 2006].

