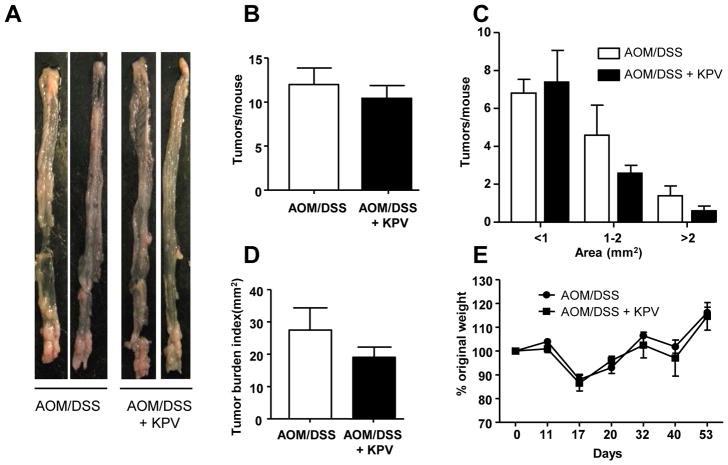
Figure 8. KPV inhibitory effect is abrogated in PepT1-KO mice.
PepT1-KO mice were treated with AOM followed by two cycles of 3% DSS, during which mice were co-treated with or without 100 μM KPV. A, Representative colons were obtained from each experimental group at the end of the AOM/DSS protocol. B, Number of tumors per mouse. C, Tumor size was determined using a dissecting microscope fitted with an ocular micrometer. The tumor size distribution was graphed. D, The tumor areas of each colon were summed, and they were presented as the tumor burden index. E, Mice were weighed on day 0, daily during the two DSS treatments, and once per week during the 2-week recovery period that followed each DSS or DSS/KPV treatment. The graph represents the % values of the original day 0 weight. Values are mean ± SEM (n=5 per group).

