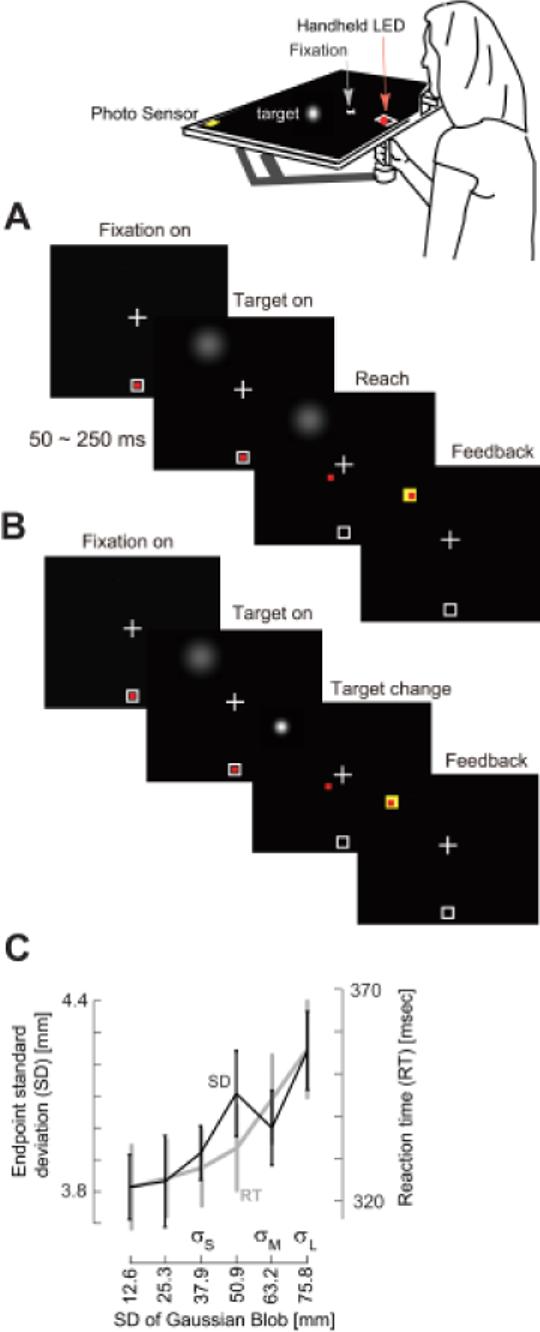
Figure 1.

Experimental procedures and results from the Control 1 experiment. A. Subjects held a handle that housed an LED (red mark) and fixated a cross at 10cm with respect to the start box. The reach target was a fuzzy blob that appeared at a random position and at a random time (0.5 to 2.5 sec) after the presentation of the fixation cross. Subjects were instructed to start their reach as soon as they saw the target and terminate their reach by placing the LED in the blob’s center. The LED was always on. After reach completion, feedback was provided to indicate distance to the blob’s center. B. On a fraction of trials, about 100ms after reach initiation the blob’s center and/or standard deviation (SD) changed. C. Endpoint standard deviations and reaction times are shown as a function of blob SD in the task shown in part A. As the target uncertainty increased, reaction times increased, and movements ended with greater spatial variance with respect to target center. Data points are mean and SEM across subjects.
