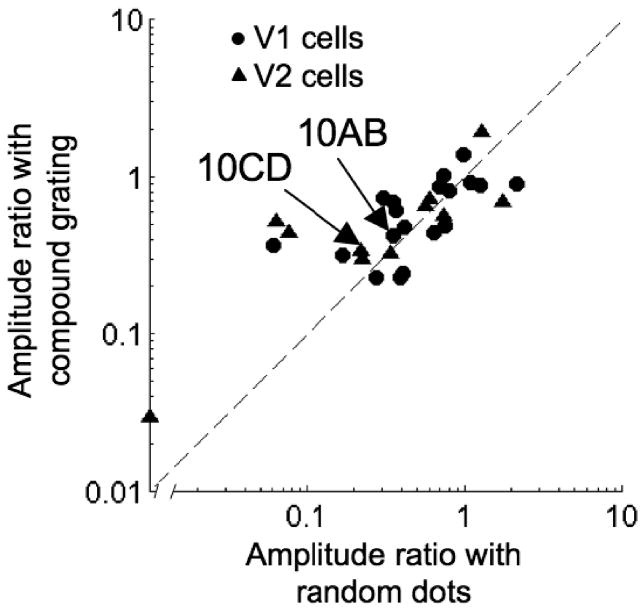
Figure 11.
Similar attenuation of responses to anticorrelated stimuli across the two image classes. For each stimulus class (i.e., compound gratings and random dots), we calculated the ratio of disparity tuning amplitude with anticorrelated stimuli over the amplitude with correlated stimuli. No difference was observed in the ratio between the image classes, in either V1 or V2.

