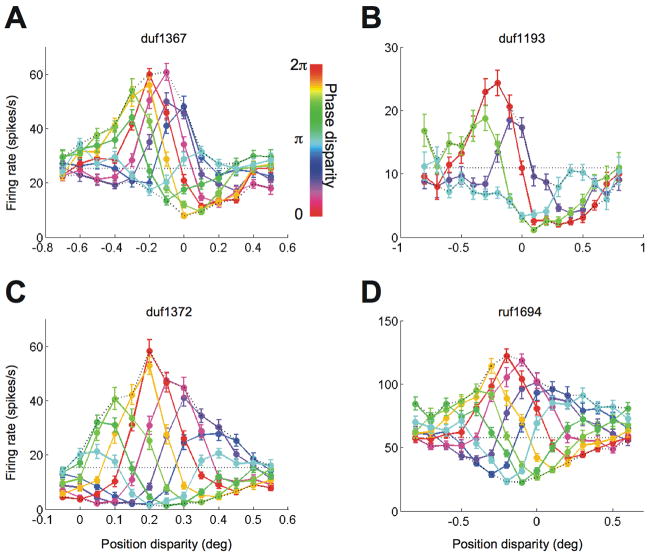
Figure 3.
Example cells from V1. A and B, Two cells are shown with an odd-symmetric component in the tuning for natural disparity (red curve). Position disparity and phase disparity were combined in the stimulus. The abscissa indicates the position disparity, and the line-color indicates the phase disparity. The upward envelopes were offset from the downward envelopes. The error-bars indicate standard error. C and D, Two cells are shown with mostly even-symmetric tuning for natural disparity. The envelopes showed no offset (D) or a poorly defined offset (C).

