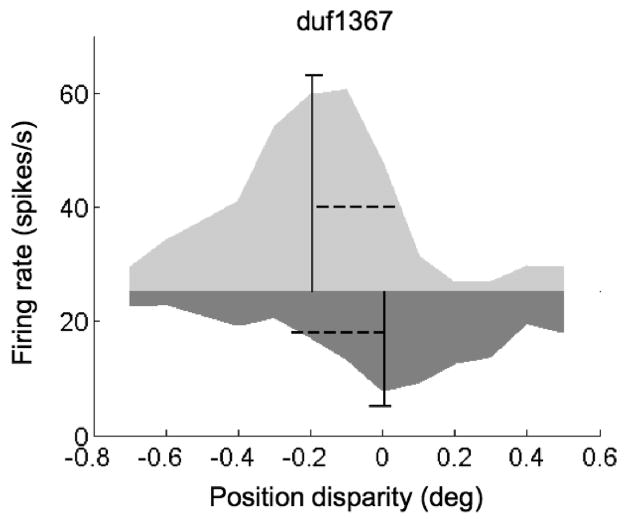
Figure 4.
Estimating offset between upward and downward envelopes. Light gray area is the upward envelope of a set of tuning curves for 8 different phase disparities. The dark gray area is the downward envelope. The boundary of the two areas is the response to an uncorrelated stimulus. The vertical solid lines indicate the estimated position (center of mass), and the horizontal dashed lines indicate the estimated width (standard deviation) of the envelopes. The small horizontal lines at the end of the vertical lines indicate the 95% confidence interval for the position estimate. This example is the same cell shown in Figure 3A.

