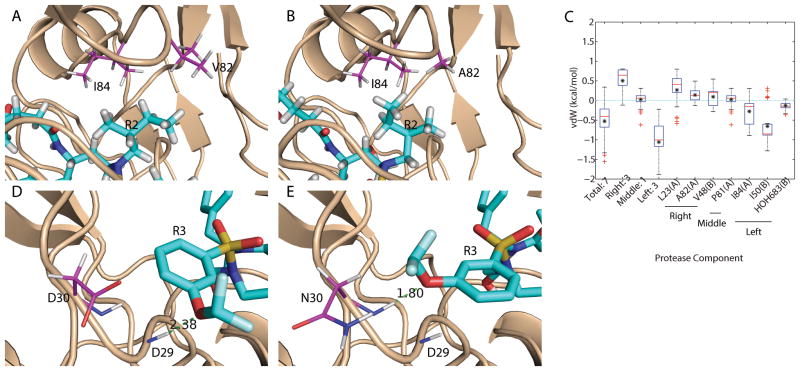
Figure 6.
Flexibility was observed as a mechanism to achieve binding promiscuity. (A,B) Asymmetric functional group R2 flipped away from V82A mutation site to form compensating van der Waals interactions. (C) Box plot of binding affinity difference for promiscuous inhibitors with asymmetric R2 that flipped away from a wild-type (WT1) conformation when binding to mutant M1. (D,E) Asymmetric functional group R3 flipped toward D30N mutation site when no longer repelled to form alternative hydrogen bond. Proteases are shown in wheat cartoons with lines representing residues that are mutated or form alternative contacts. Ligands are shown in cyan sticks. Carbon atoms are magenta for proteases and cyan for ligands. The other elements follow the same color code: red for oxygen, blue for nitrogen, white for hydrogen, yellow for sulfur, and pale cyan for fluorine. Red bars and black asterisks in the box plot correspond to median and mean values correspondingly.

