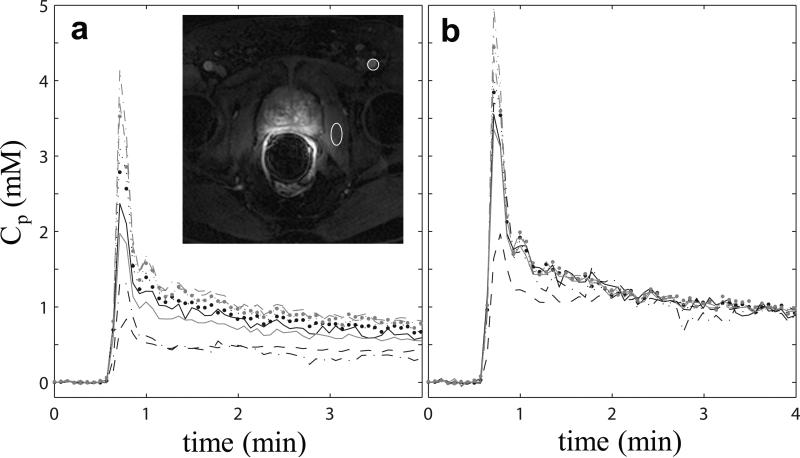
Figure 1.
a.Individual AIFs extracted from one subject's DCE-MRI data by nine participating QIN (Quantitative Imaging Network) centers. The smaller circular ROI in the zoomed image inset (with the prostate in the center of the view) indicates the general location where blood signals are most frequently measured for the final AIF time-courses, and the larger elliptical ROI indicates the general location for the obturator muscle reference tissue ROI. Noticeable variations are evident for both the shape and magnitude of the AIF curves. 1b The reference-tissue-adjusted AIFs of the same subject. The agreement among the individually measured AIFs is clearly improved following the adjustment.

