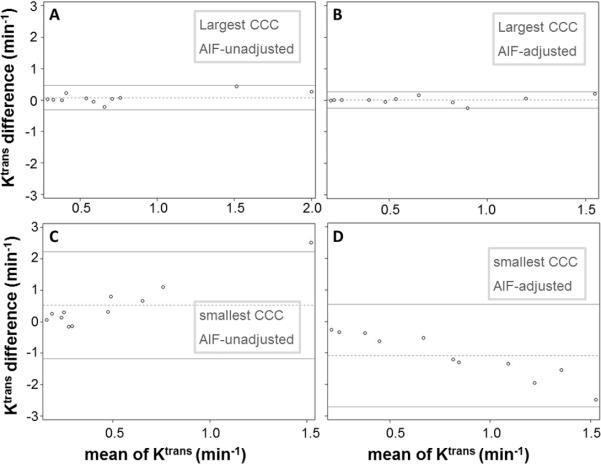
Figure 6.
Bland-Altman plots are shown to demonstrate agreement in Ktrans for AIF pairs with the largest (A and B) and smallest (C and D) CCC values within the unadjusted (A and C) and adjusted (B and D) AIF groups. The two solid horizontal lines represent the upper and lower limits of the 95% confidence interval, while the dotted horizontal line represents the mean value of Ktrans differences between the two measurements.

