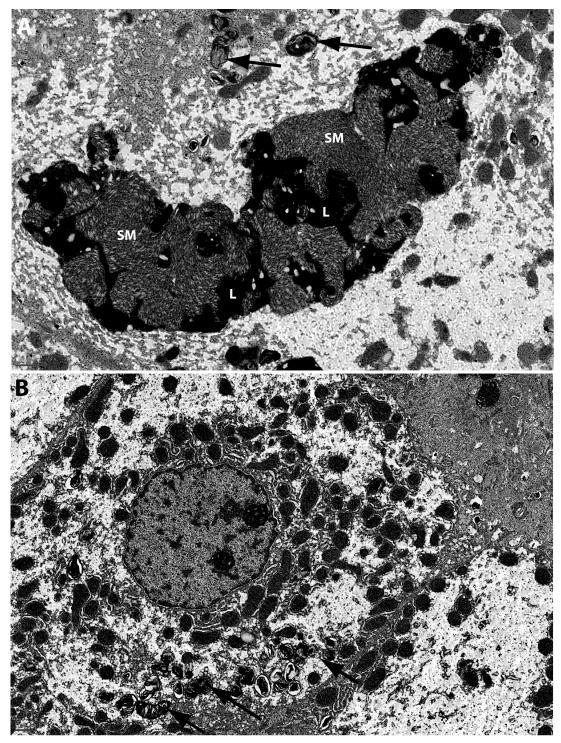
Figure 5. Electron microscopy examination of sphingomyelin accumulation and clearance from Hepatocytes.
Panel A demonstrates the presence of large sphingomyelin masses (SM) mixed with lipofuscin (L) within hepatocytes at baseline in patient 5. Smaller whorls of sphingomyelin are also present (black arrows). Panel B demonstrates the reduction of sphingomyelin after 26 weeks of olipudase alfa treatment. Black arrows indicate residual sphingomyelin. EM scale bars = 1μm.

