
Figure 1. Areas of significantly (puncorr<0.001) reduced cortical perfusion in RRMS subgroups and healthy controls, with volumes for atrophied regions added as covariates.
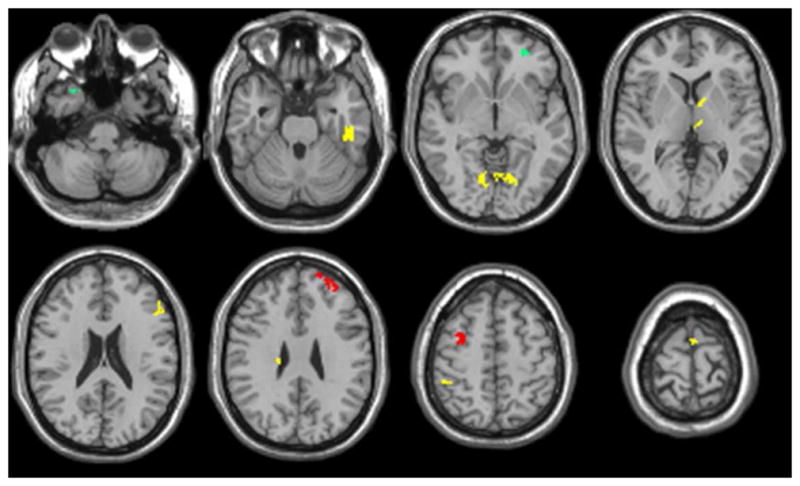
Green, healthy controls vs. non-impaired RRMS; Red, healthy controls vs. cognitively impaired RRMS; Yellow, non-impaired RRMS vs cognitively impaired RRMS.