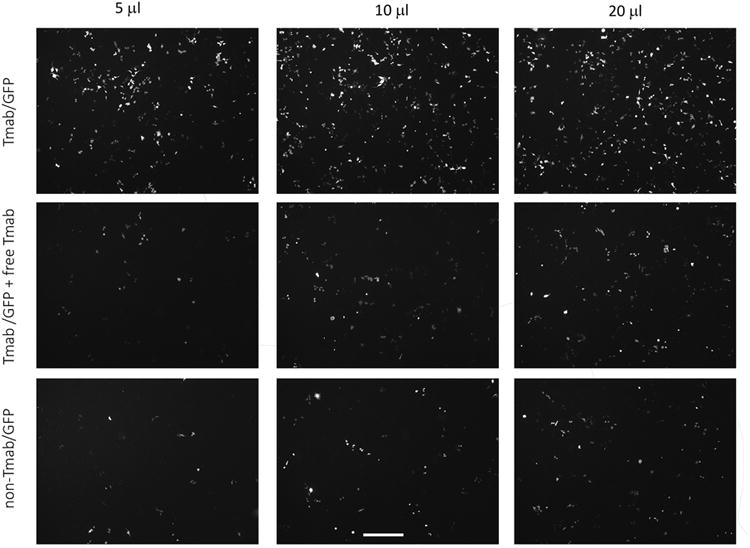
Figure 1.

GFP expression in ce2 cells treated with GFP-nanocomplexes. Ce2 cells were treated for 3 hrs with GFP DNA complexes (dosages from 5 μl to 20 μl) containing LLO and Tmab (upper row), containing LLO and Tmab along with free Tmab in the medium as competitor (middle row), or containing LLO without Tmab in the complexes (lower row). Fluorescent cells were visualized 48 hrs after treatment with an inverted fluorescence microscope, and photographs taken with the 5× objective. The scale bar equals 500 microns.
