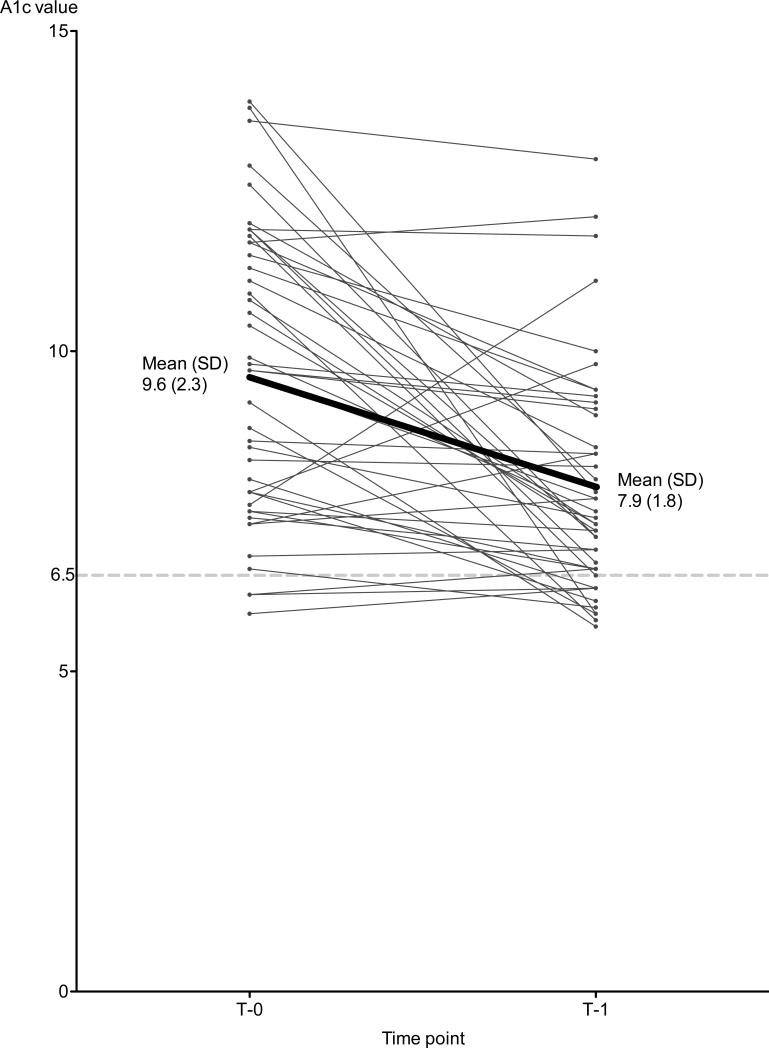
Figure 1.
Change in hemoglobin A1c values from initial presentation to the Shade Tree Clinic (T-0) to 12 ± 3 months later (T-1). At T-0, the mean (standard deviation) A1c value was 9.6 (2.3); at T-1, 7.9 (1.8). A related-samples Wilcoxon Signed Rank Test showed a significant difference in median A1c values at T-0 and T-1 (P < .0001). The mean change was 1.7 (95% confidence interval 1.1-2.5). The thin lines indicate individual patient's A1c values and the thick line indicates the mean value. The dotted line indicates the reference value of 6.5, which is the American Diabetes Association goal value.

