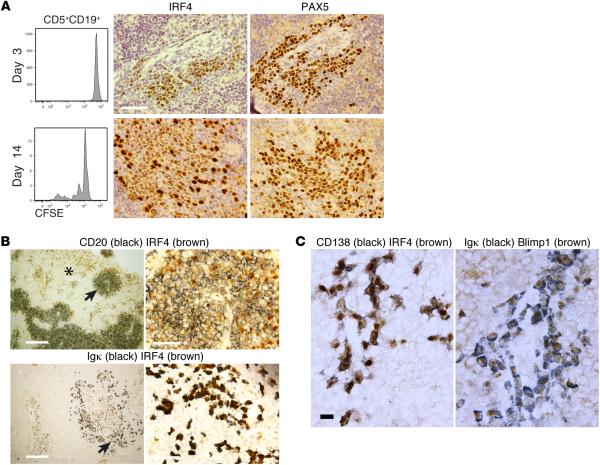
Figure 6. IRF4 and Blimp-1 protein are expressed during CLL B cell differentiation and diversification.
(A) Upper panels show FC of undivided CFSE-labeled human (h) CD45+CD5+CD19+ cells with companion IH images of IRF4 and PAX5 (day 3). Lower panels show FC of dividing CFSE-labeled hCD45+CD5+CD19+ cells with companion IH images of IRF4 and PAX5 (day 14). Scale bar: 50 μm. Representative data of mice sampled from 5 independent experiments. (B) IRF4 staining is seen within (arrow, upper left) and outside of (*, upper left) CD20+PAX5+PVAs, being expressed dimly by CD20+ cells and more intensely by cIg+ cells. Upper panels: dual IH images of CD20 (black) and IRF4 (brown); left hand panel (scale bar: 250 μm), with high-power view of area marked with arrow on right (scale bar: 50 μm). Lower panels: dual IH images of Igκ (black) and IRF4 (brown); left hand panel (scale bar: 250 μm), with high-power view of area marked with arrow on right (scale bar: 50 μm). Representative data of dual IH performed on mice sampled from 5 independent experiments. (C) Dual IH of spleen-residing cells 6 weeks following transfer indicates chronic lymphocytic leukemia (CLL) plasmablasts/plasma cells express IRF4 and Blimp-1. Scale bar: 10 μm. Representative data of mice sampled from 6 independent experiments. FC, flow cytometry; PVA, perivascular aggregate; IH, immunohistology; cIg, cytoplasmic immunoglobulin.

