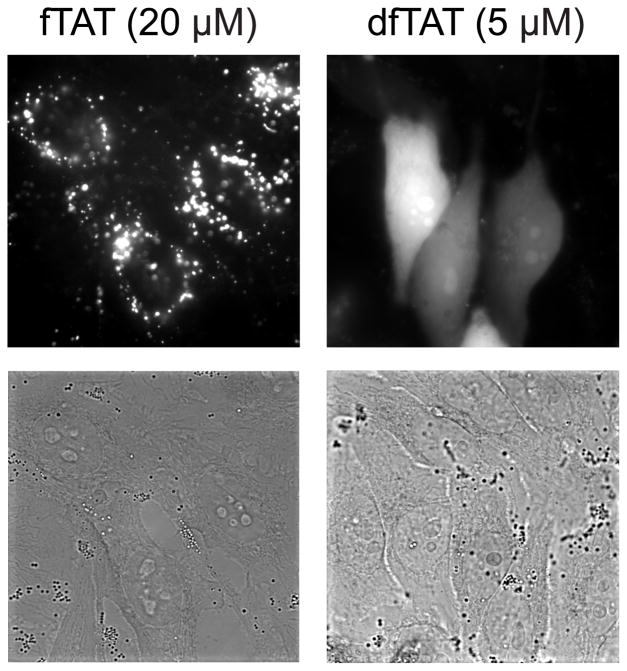
Figure 1.
Fluorescence (monochrome) and bright field images (100X objective) of HeLa cells incubated with 20 μM fTAT (monomeric fluorescently-labeled TAT, left panel) and 5 μM dfTAT (dimeric fluorescently-labeled TAT, right panel). The fTAT peptide displays a fluorescence punctate distribution while dfTAT exhibits a cytosolic and nuclear fluorescence distribution. Bright field images show no change in HeLa cell morphology upon peptide delivery. Scale bar, 10 μm.

