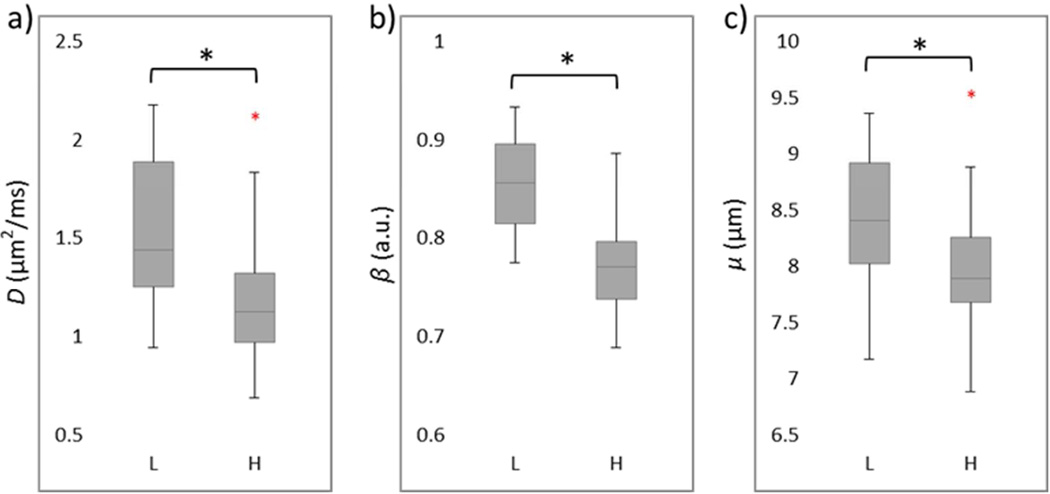
Figure 3.
Box plots of FROC parameters D (a), β (b), and μ (c) between the low- (L) and high-grade (H) gliomas. Boxes represent the 25th and 75th percentiles with the median indicated by the middle line in the box. Vertical end bars denote the range of data except for the outliers (i.e., values larger than the 75th percentile or smaller than the 25th percentile) represented by red +. The asterisk (*) indicates a significant difference (p < 0.05) between the low- and high-grade gliomas.

