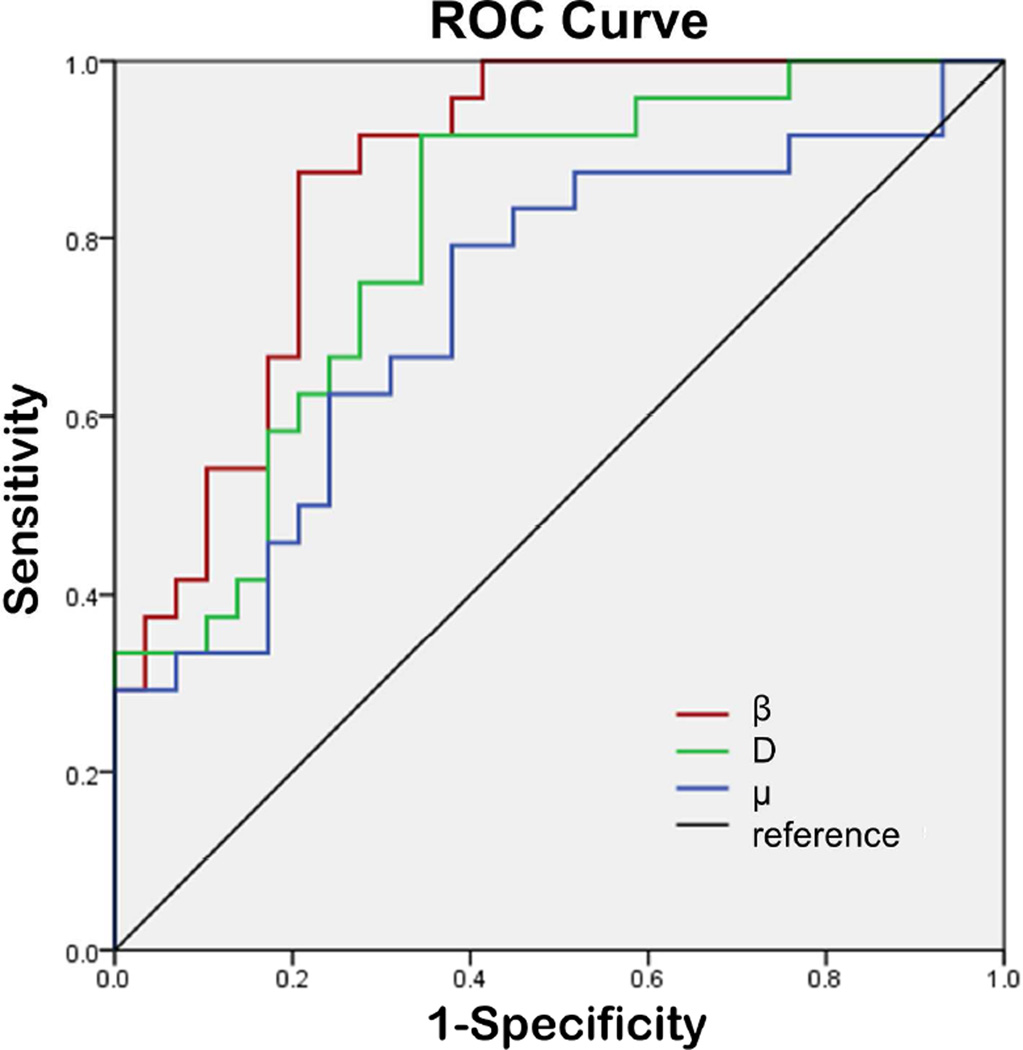
Figure 5.
Scatter plots of D vs. μ (a) and D vs. β (b) from all patients (the blue diamonds represent low grade and the red triangles denote high grade). A very strong correlation between D and μ (a) (Pearson’s correlation coefficient r = 0.930; p < 0.001) and a weaker correlation between D and β (b) (Pearson’s correlation coefficient r = 0.766; p < 0.001) are illustrated. The dashed lines in (b) indicate the cutoff values for D (red), β (green), and the combination of D and β (black; linear equation: β=0.000497D+0.798)

