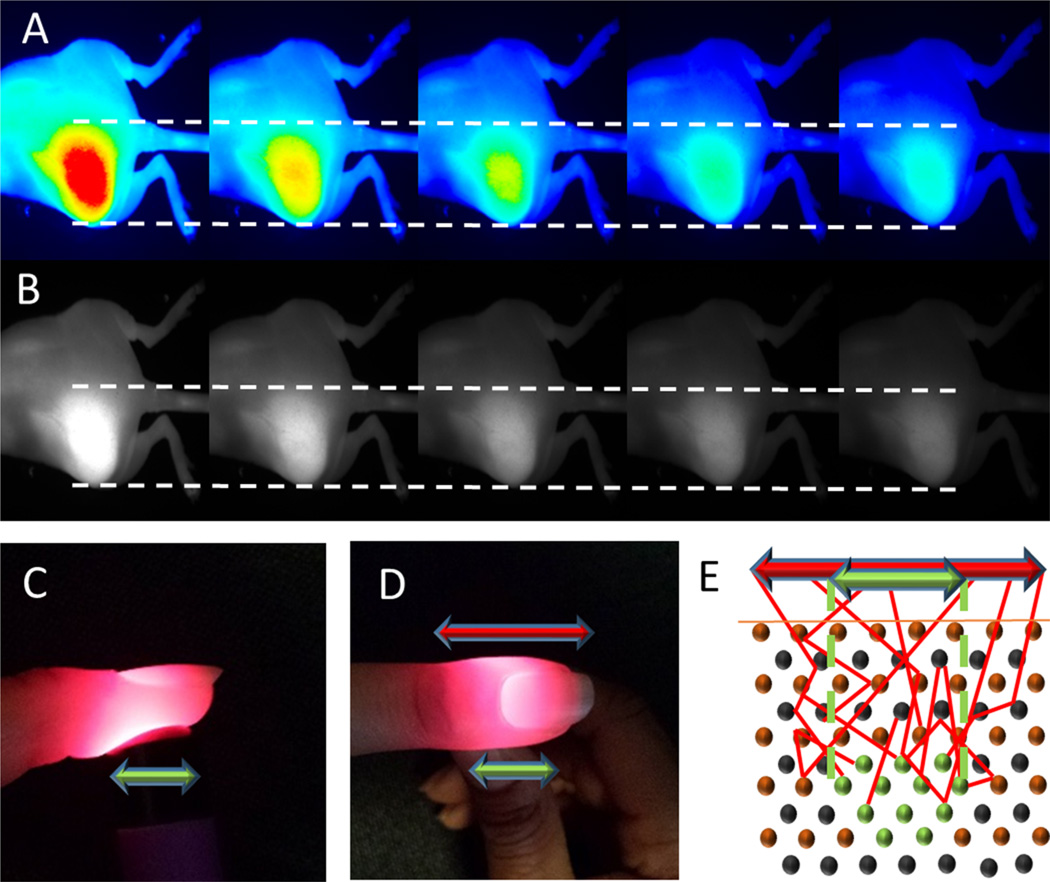
Figure 1.
Color images of a fluorescent tumor and surrounding tissue with the maximum intensity set to different values (from left to right): 1.0, 1.5, 2.0, 2.5, and 3.0 a.u. (A). Grayscale images of the same tumor set to the same maximum intensity values as the color images (B). Side and top images of light scattering in tissue, with the apparent width of the source at the top of the finger (red arrow) larger than the actual width of the light source (green arrow) (C) and (D). Illustration of a light-emitting fluorescent tumor (light source) within the scattering medium (E). The red arrow shows the observed width at the surface of the tissue, and the green arrow shows the actual width of the tumor within the surrounding tissue.

