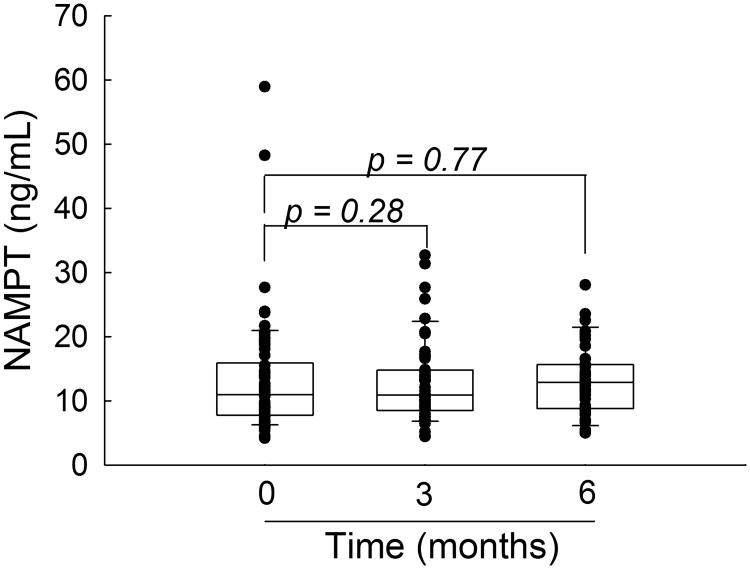
Figure 2.
Plasma NAMPT concentrations in JIA following initiation of MTX. NAMPT concentrations were measured in plasma samples obtained from JIA patients prior to the initiation of MTX therapy and after 3- and 6-months of therapy. Data points and representative box and whisker plots are shown for each time-point. Changes in NAMPT values were evaluated by matched pair analysis using the Wilcoxon signed-rank test and the resulting p-values are provided.

