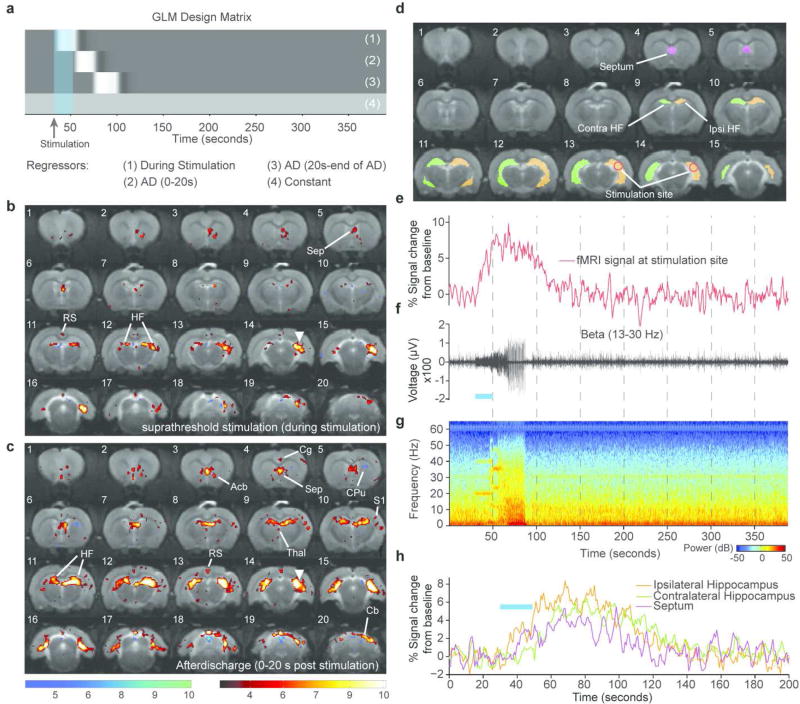
Figure 1. Single subject simultaneous LFP and optogenetic fMRI during seizure-inducing (suprathreshold) stimulation of the hippocampus.
(a) GLM design matrix for the fMRI analysis. (b) T-statistic map showing regions of significant BOLD signal change during a seizure-inducing stimulation (average of 2 trials). (c) T-statistic map showing regions of significant BOLD signal change during the first 20 s an epileptiform afterdischarge. Site of optical stimulation is marked by the white triangle. (d) Segmentation of 4 different ROIs. (e) fMRI time course shown for a single trial. (f) Single trial simultaneously recorded LFP shown for the Beta band 13–30 Hz. (g) Spectrogram of the LFP recording during fMRI acquisition. (h) fMRI time course for the single trial shown from the ipsilateral hippocampus, septum and contralateral hippocampus. Duration of optical stimulations are marked by blue bars. T-statistic maps are thresholded at a significance level of p<0.01, voxel-wise FDR corrected. Abbreviations: Acb - Accumbens Nucleus, Cpu - Caudate Putamen, RS - Retrosplenial Cortex, Thal - Thalamus, Cg - Cingulate Cortex, HF - Hippocampal Formation, S1 - Primary Somatosensory Cortex, Sep - Septum. (Reproduced from Duffy et al., 2015, Copyright (2015) with permission from Elsevier)

