
Fig. 2. Obesity impairs lymphatic transport of macromolecules to draining lymph nodes.
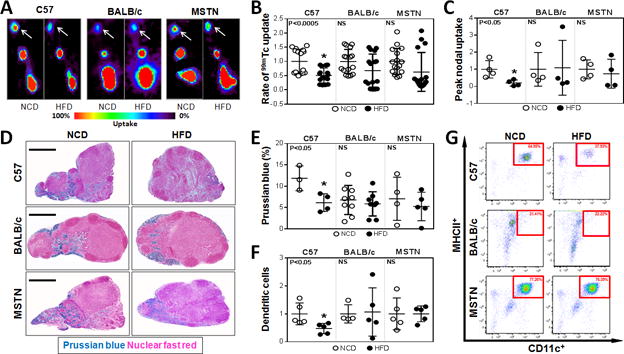
A. Representative hindlimb 99mTc heat maps for NCD- and HFD-fed C57BL/6J, BALB/cJ, and MSTNln mice. White arrows indicate the uptake in the inguinal lymph nodes (n=4/group).
B. Quantification of the rate of 99mTc uptake in inguinal lymph nodes following hindlimb injection. Data is presented as fold change relative to their NCD controls in each group (n=16/group). C57BL/6J HFD vs. NCD (*p<0.0005). MSTNln and BALB/cJ had no significant difference between NCD and HFD groups.
C. Quantification of peak nodal uptake of 99mTc in inguinal lymph nodes following hindlimb injection. Data are presented as fold change relative to their NCD controls in each group (n=4/group). C57BL/6J HFD vs. NCD (*p<0.05). MSTNln and BALB/cJ had no significant difference between NCD and HFD groups.
D. Representative Prussian blue stained histological cross sections of axillary lymph nodes harvested from NCD- or HFD-fed mice in all groups. (Scale bar=500μm).
E. Quantification of Prussian blue staining as a percentage of the total lymph node area in NCD- and HFD-fed mice (n=3–9/group). C57BL/6J HFD vs. NCD (*p<0.05). MSTNln and BALB/cJ had no significant difference between NCD and HFD groups.
F. Quantification of migrating CD45.1+ dendritic cells (MHCII+/CD11C+) in inguinal and popliteal lymph nodes of NCD- (open circles) and HFD- (filled circles) fed mice in all groups (n=5/group). Data are presented as fold change from respective NCD-fed controls. C57BL/6J HFD vs. NCD (*p<0.05). MSTNln and BALB/cJ had no significant difference between NCD and HFD groups.
G. Representative dot plot graphs of inguinal/popliteal lymph node flow cytometry analyzing migrating CD45.1+ dendritic cells in all groups. Red square surrounds dendritic cell population.