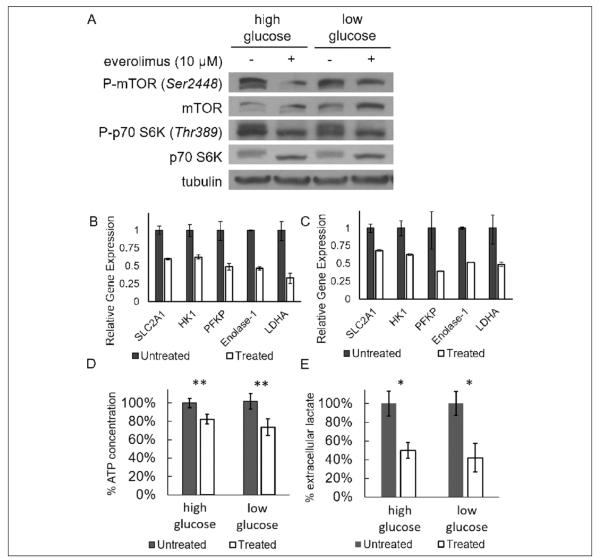
Figure 1.
The effect of 10 μmol/L everolimus treatment on tumor cell metabolism after 24 hours of treatment. A, Everolimus caused a decrease in phosphorylation of mammalian target of rapamycin (mTOR) and p70 S6 kinase in Granta 519 cells as evaluated with a Western blot. B, The differences in gene expression levels between the everolimus-treated and control groups in a low-glucose (1 g/L) media. C, The relative differences in gene expression levels in a high-glucose (4.5 g/L) media. Vehicle control data were normalized to 1. D, Intracellular ATP concentration (normalized to untreated groups) decreased with everolimus treatment in both high- and low-glucose conditions. E, Lactate normalized to total protein (normalized to control groups) decreased by approximately 50% in both high- and low-glucose conditions when treated with everolimus. *P < 0.05; **P < 0.0001.

