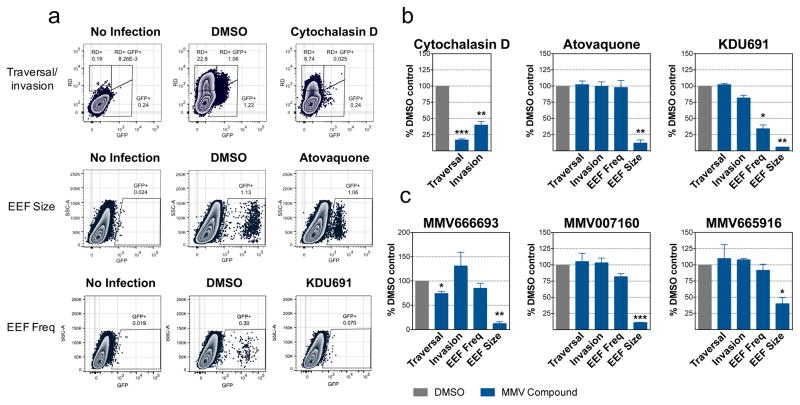
Figure 6. Validation of exoerythrocytic-stage activity using an established flow cytometry-based assay.
a) Flow cytometry plots measuring traversal and invasion (at 2 hours post infection), and EEF frequency and development (at 48 hours post infection) of exoerythrocytic-stage malaria parasites in Huh7.5.1 cells as previously described for three of the most potent compounds. Cytochalasin D was used as a positive control for traversal and invasion, KDU691 was used as a positive control for EEF frequency, and atovaquone was used as a positive control for EEF frequency and development. While traversal was measured by the percentage of Rhodamine-dextran single-positive cells, invasion was measured by the percentage of Pb-GFP single-positive cells at 2 hours post infection. At 48 hours post infection, EEF frequency was measured by the percentage of Pb-GFP-positive cells, and EEF development was measured by the relative mean fluorescence intensity (MFI). Representative flow cytometry plots are shown. Atovaquone was tested at 1uM (due to slight cytotoxicity at 10 μM in Huh7.5.1 cells, (Figure S4), and Cytochalasin D and KDU691 was tested at 10 μM.
b) The mean and SEM are shown graphically from the traversal/invasion, EEF frequency, and EEF size control experiments shown in Figure 6a above (cytochalasin D, atovaquone, and KDU691, respectively). Values are normalized to the DMSO control.
c) Exoerythrocytic-stage traversal, invasion, EEF frequency, and EEF development are shown for MMV666693, MMV007160, and MMV665916. Mean and SEM from three replicate experiments are shown. MMV66693 was tested at 1 μM (due to slight cytotoxicity at 10 μM in Huh7.5.1 cells, (Figure S4), and MMV007160 and MMV665916 were tested at 10 μM.

