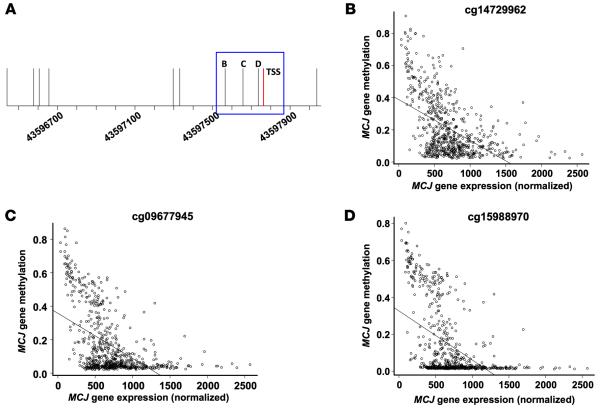
Figure 6. MCJ proximal promoter DNA methylation and gene expression in TCGA breast tumors.
(A) Line drawing of the MCJ gene promoter region with genomic position and transcription start site (TSS) in red. Vertical lines indicate CpG sites and are labeled to indicate CpGs plotted in B–D. (B–D) MCJ gene expression versus DNA methylation in TCGA breast tumors (n = 684) at promoter CpGs cg14729962 (B), cg09677945 (C), and cg15988970 (D) indicates increased expression associated with decreased DNA methylation (all P values < 2.2 × 10⁻¹⁶ by linear regression).

