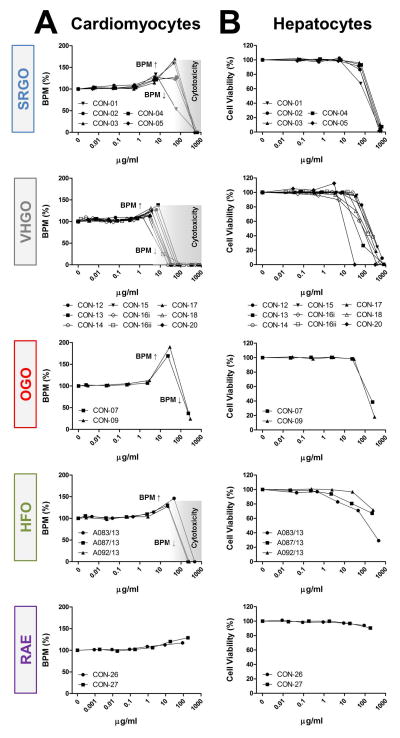
Figure 2.
Category-specific biological effects of petroleum substances. petroleum substance product group-specific concentration-response plots for representative phenotypes cardiomyocyte peak frequency (a) and hepatocyte viability (b) are shown. data points represent means of duplicate determinations (n=2). grey zones indicate cytotoxic concentrations based on cell viability measurements. [bpm = beats per minute, cardiomyocyte beat frequency; vhgo = vacuum & hydrotreated gas oils; srgo = straight run gas oils; ogo = other gas oils; hfo = heavy fuel oils; rae = residual aromatic extracts]

