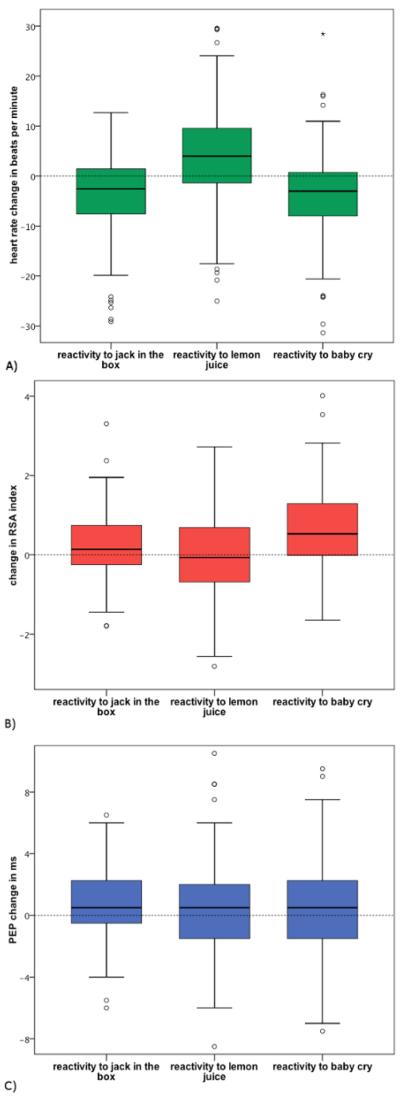
Figure 5. Boxplots Representing Heart Rate, Parasympathetic, and Sympathetic Activity by Developmental Challenge Task.
(A) represents heart rate reactivity, (B) represents RSA reactivity, and (C) represents PEP reactivity. Note: the boxes represent the interquartile range containing the middle 50% of values, with the line across the box representing the median. The whiskers extend from the highest and lowest values, excluding outliers which lie at least 1.5 box lengths outside the box. Please click here to view a larger version of this figure.

