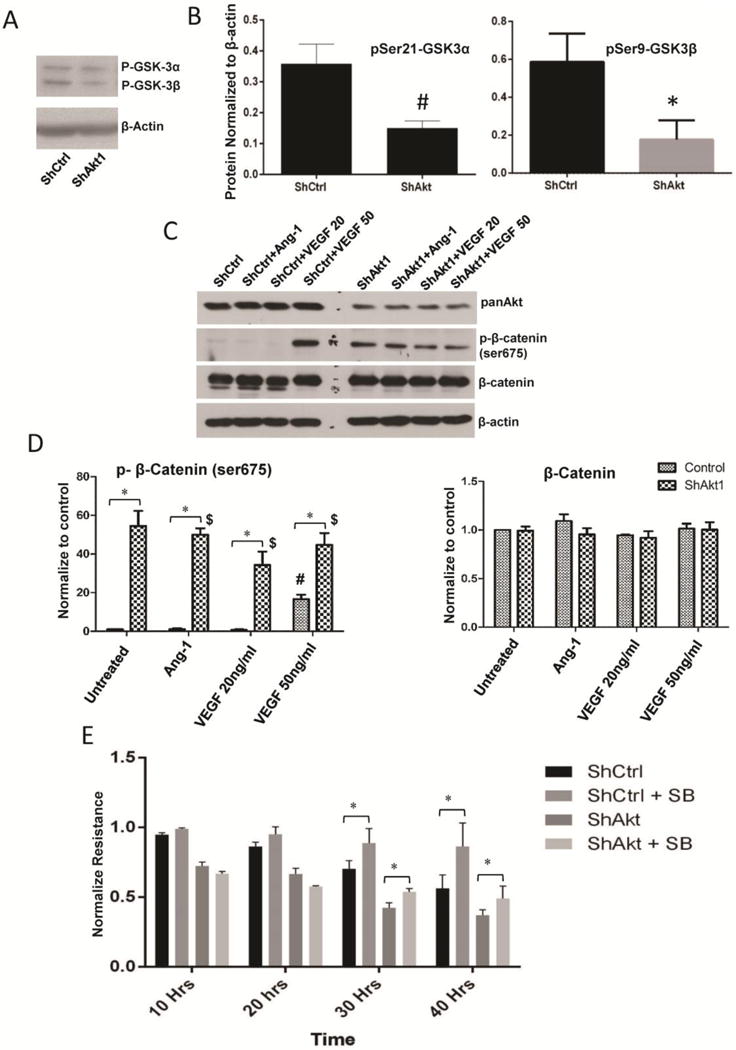
Figure 8. Pharmacological inhibition of GSK-3 in ShAkt1 HMEC partially restores the endothelial-barrier integrity in the long-term.

(A–B) Resperesentative Western blot images of ShControl and ShAkt1 HMEC lysates showing basal levels Ser9/21 phosphorylation of of GSK-3α/β (n=3). (C) Resperesentative Western blot images of ShControl and ShAkt1 HMEC lysates treated with PBS, 20 ng/ml VEGF, 50 ng/ml VEGF and 50 ng/ml Ang1 showing a comparison on phosphorylation and total expression of β-catenin, a GSK-3 substrate. (D) Densitometry analysis of Western blots of ShControl and ShAkt1 HMEC lysates treated with PBS, 20 ng/ml VEGF, 50 ng/ml VEGF and 50 ng/ml Ang1 showing a comparison on phosphorylation and total expression of β-catenin (n=3). (E) Bar graph showing the effect of GSK-3 inhibitor SB415286 (20 μM) on endothelial-barrier resistance in ShControl and ShAkt1 HMEC as measured from the ECIS equipment (n=4).*P < 0.01, #P < 0.05, $Compared to untreated control.
