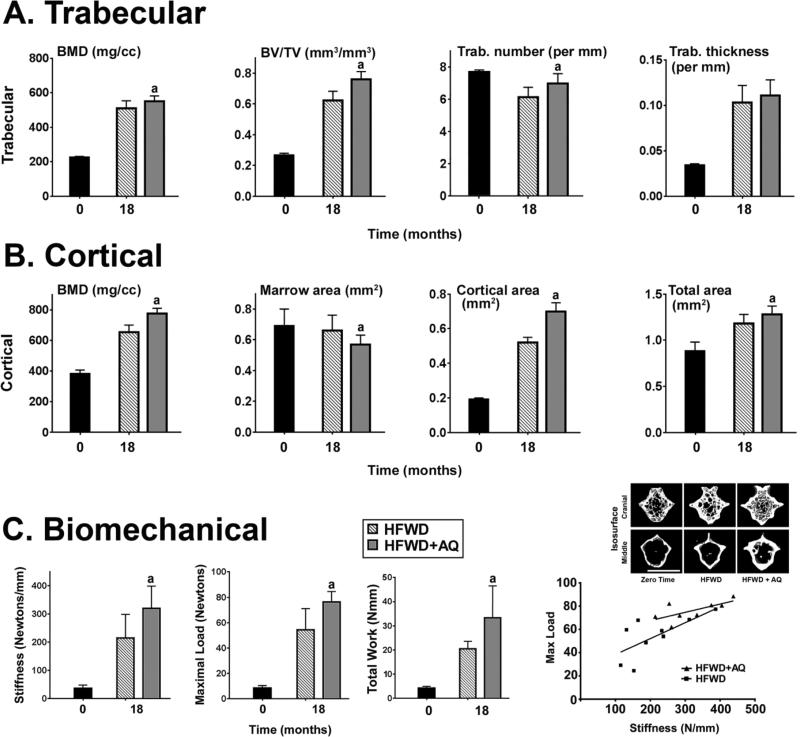
Figure 4. Vertebral bone structure and function. A: Structural features of trabecular bone. B: Structural features of cortical bone C: Biomechanical properties.
Data are based on 10 mice at the 18-month time-point in each group. Values are means and standard deviations. Statistical significance of each parameter was assessed using the Student t-test. Statistical significance at the p<0.05 level is indicated by the letter “a” above the HFWD + AQ bar, which indicates statistically significant improvement relative to HFWD alone. The right lower panel (scatter plot) shows the positive correlation between stiffness and strength in individual mice. All of the C8 vertebral micro-CT trabecular / cortical bone parameters and biomechanical properties measured at the 18 month time-point are presented in Supplement Tables 6 and 7. Insert: A representative 3D micro-CT image of trabecular (surface) and cortical (diaphysis) region from the C8 caudal vertebrae of a mouse in each diet group at zero time and 18 month (magnification bar=1mm).

